
The home improvement market is in a complex state in 2026. In a nutshell, nominal spending has been growing, despite softer demand. However, that doesn’t capture the full story, where inflation is driving nominal growth but actually causing market contractions for both the professional and consumer segment.
Meanwhile, there are fewer households participating in home improvement activity, as households increasingly deal with inflation, high mortgage rates, stagnant disposable income levels, and overall negative segment.
During The North American Hardware and Paint Association's 2026 Independent Home Improvement Conference, HIRI's Executive Director, Dave King, offered a comprehensive overview of the state of the home improvement market and key macroeconomic insights to help home improvement industry stakeholders, including retailers and manufacturers, understand what’s going on in 2026, how it fits into a historical narrative, and what to keep an eye on for the long-term health of the industry.
Why the Home Improvement Market Feels Slow When Sales are Growing
If your traffic feels softer than your sales, you’re not imagining it. The home improvement market can feel slow because current-dollar sales growth does not necessarily reflect real demand growth. Throughout 2020 to 2022, real home improvement spending per home peaked at $1,148 per quarter in Q2 2021, the highest level since 1973, based on research shared by Dave in his presentation. There was a genuine increase in demand, and homeowners had more time at their residences, spurring a natural interest in doing improvement projects. Those factors helped drive growth for stakeholders across the industry. In 2026, by some indicators, the home improvement market appears to still be growing.
However, inflation increases the dollar value of purchases, which can make revenue appear healthy even as unit sales or inflation-adjusted demand decline. In fact, the real spend per home is now $892, below the $985 average since 1970. That gap is why a positive forecast still feels flat at the check-out. When developing business strategies, it’s important for home improvement brands to evaluate both nominal and real growth to better understand actual market conditions.
What is Nominal Versus Inflation-Adjusted Growth?
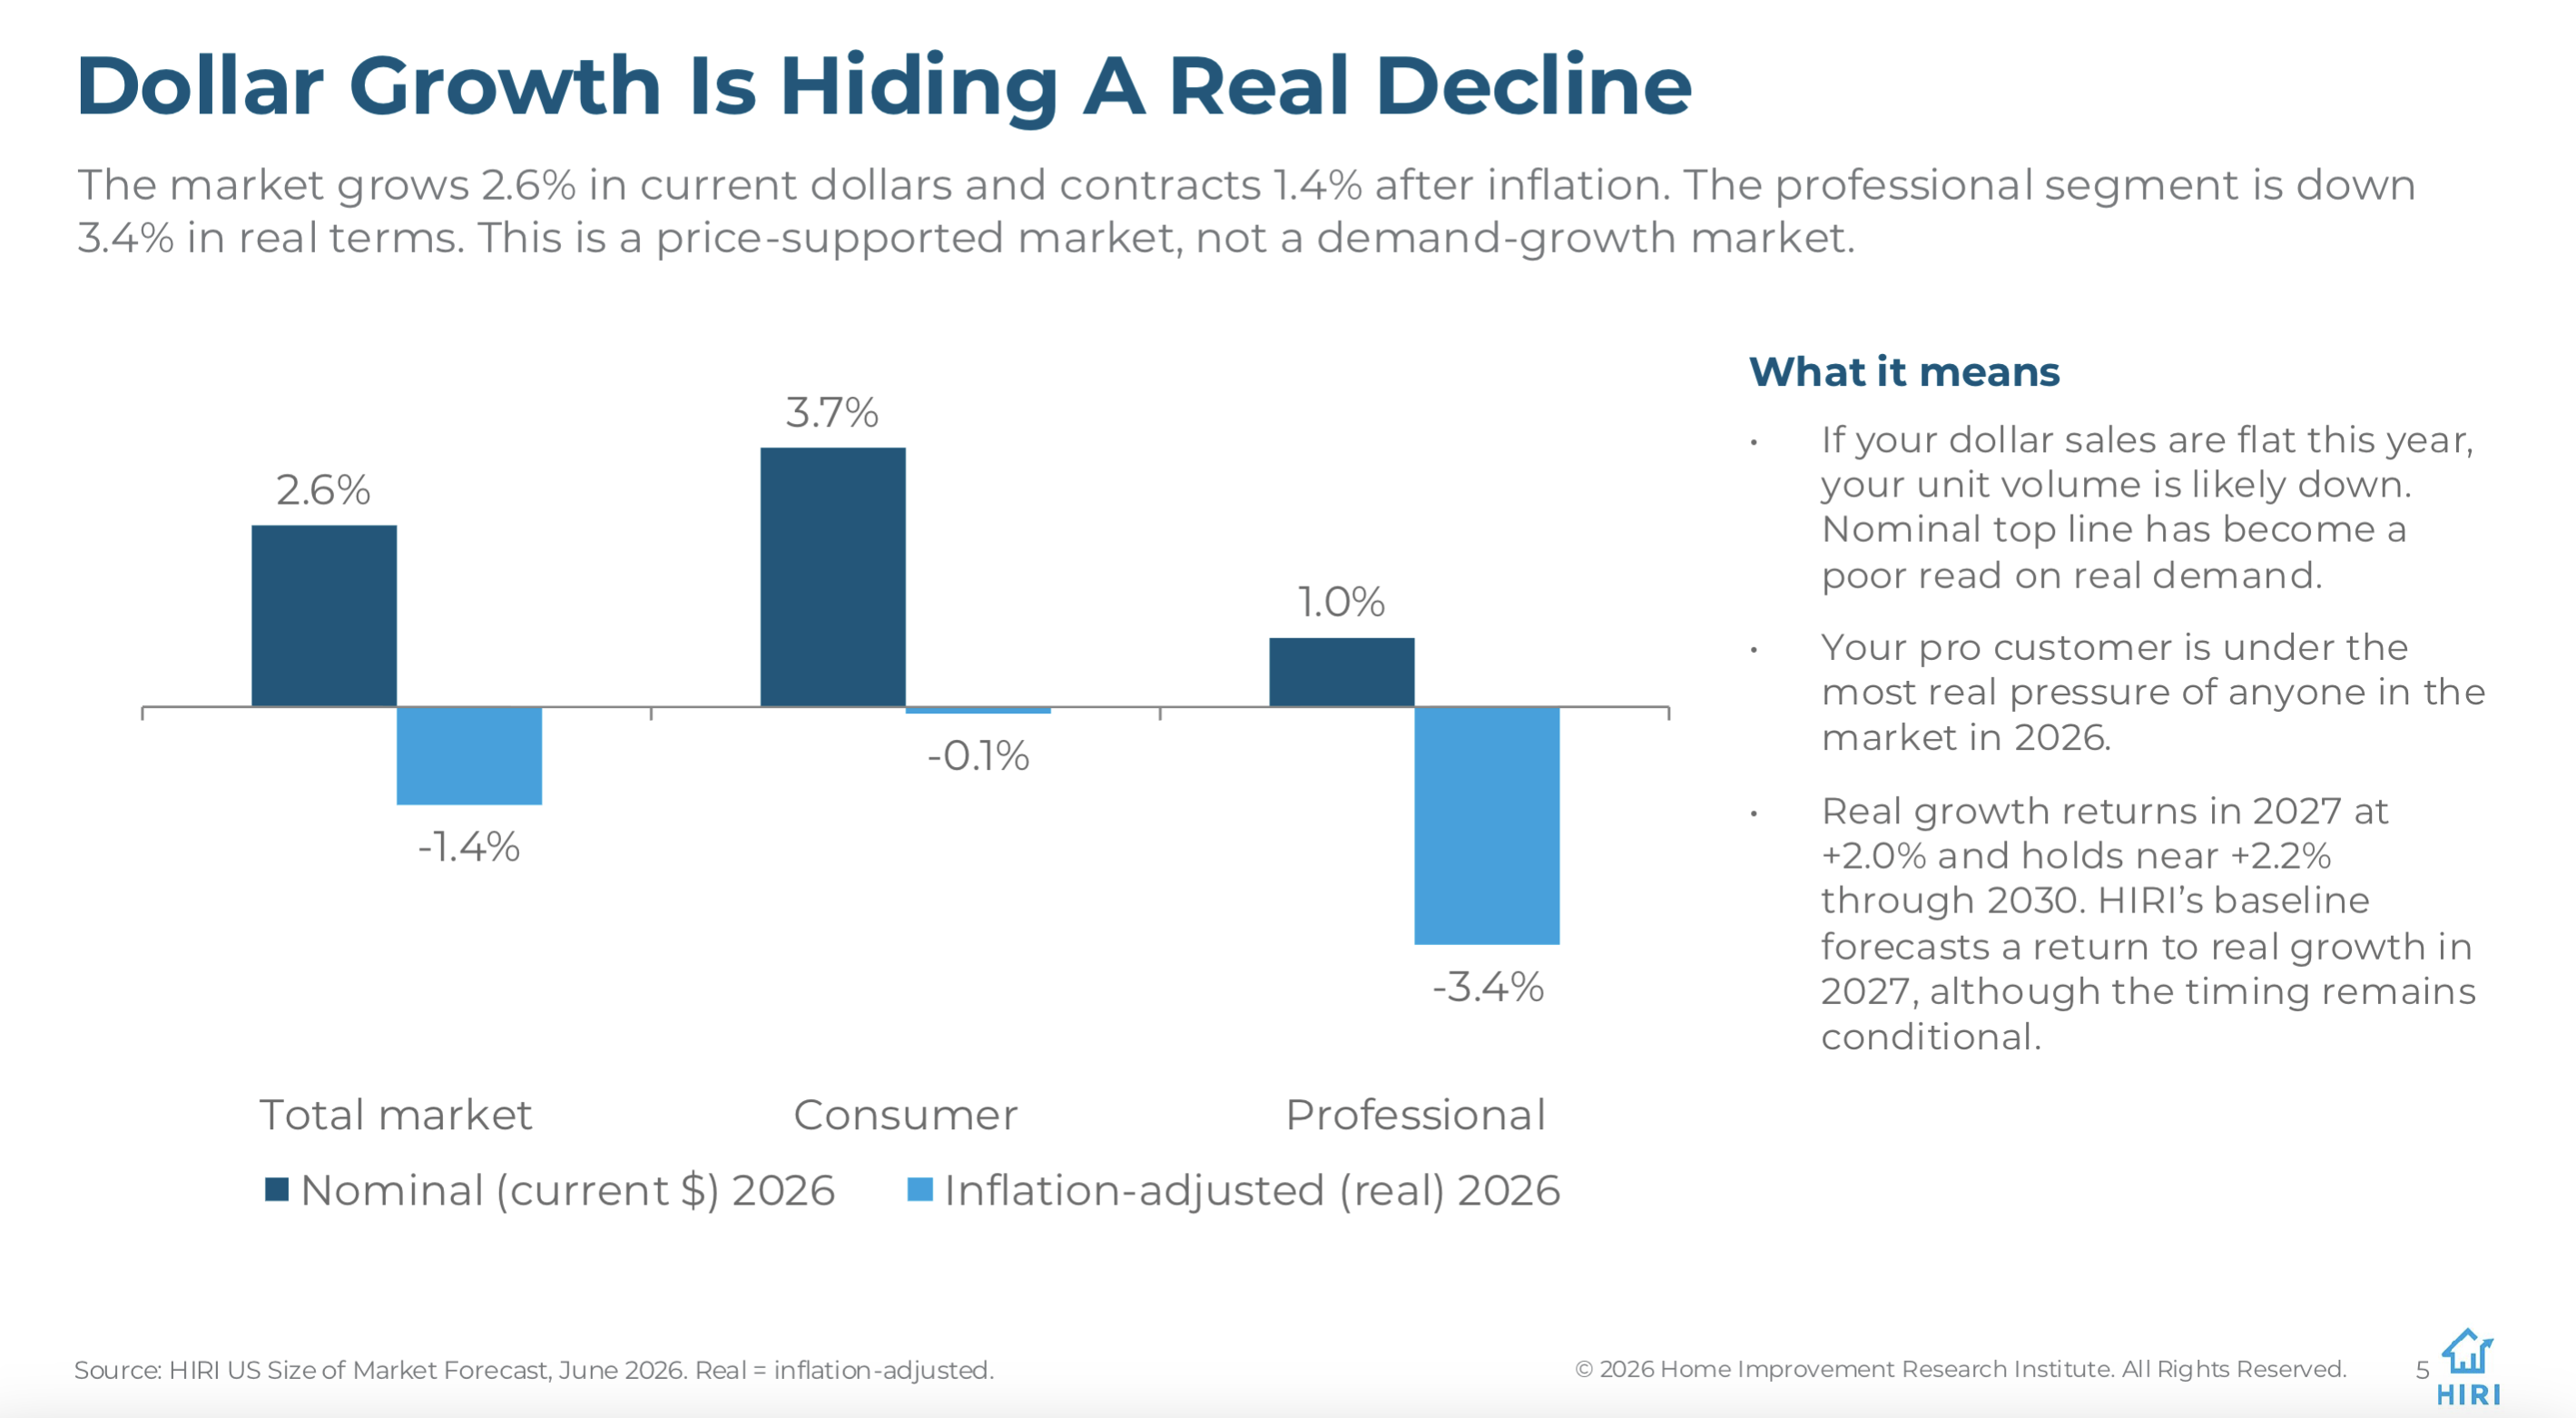
Nominal growth measures market performance using current prices, while real growth accounts for inflation to show changes in actual purchasing activity. For example, the home improvement market is projected to grow approximately 2.6% in current dollars, but that growth in spending is due to increased prices, not additional customers or conversions. When adjusted for inflation, the market is actually expected to shrink by roughly 1.4% in 2026, based on data from HIRI's Quarterly U.S. Size of the Home Improvement Products Market Report and Forecast.
Looking closer:
- The outlook for the consumer segment is 3.7% in nominal growth but -0.1% when adjusted for inflation
- The outlook for the professional segment is 1% in nominal growth but -3.4% when adjusted for inflation
For building product manufacturers and retailers, understanding this distinction helps explain why revenue may increase while customer demand or project volume remains flat or declines. The nominal top line has become a poor read on real demand because we’re in a price-supported market, rather than a demand-growth market. Growth is no longer something you receive, but something you must create by inspiring customers to start postponed projects or taking share from competitors from those who are already active.
How Manufacturers Should Interpret Sales Data Differently in 2026
Because inflation is obscuring what is happening in the home improvement industry, building product manufacturers must go beyond nominal growth forecasts and look at other data points to plan strategically for the final quarter of 2026 and into 2027. This includes analyzing historical data, inflation-adjusted growth projections, projection participation, overall home improvement activity, and what triggers are (or aren’t) generating demand.
What Does Empirical Data Tell Us About the Long-Term Trajectory of the Market?
Approximately 55 years of historical data collected by HIRI can put the current landscape into context. There have been several cycles over the past five decades when it comes to quarterly home improvement spending per household. Across the four prior cycles, the average peak-to-trough decline is about -30% in spending. Most recently, average quarterly spending among households peaked at $1,148 in Q2 2021 to $892 in Q3 2025, which represents a -22% decline. There may be several points left to fall in the coming quarters, but historically, each drop is followed by a recovery.
The Decline of First-Time Homebuyers as a Demand Trigger
Based on data from the National Association of Realtors (NAR), analyzed by HIRI and The Farnsworth Group, the past four years (from 2022 through 2025) produced the fewest first-time buyers in at least 25 years, removing a powerful source of move-related home improvement spending. The lowest level was in 2024, with only approximately 0.95 million first-time buyers.
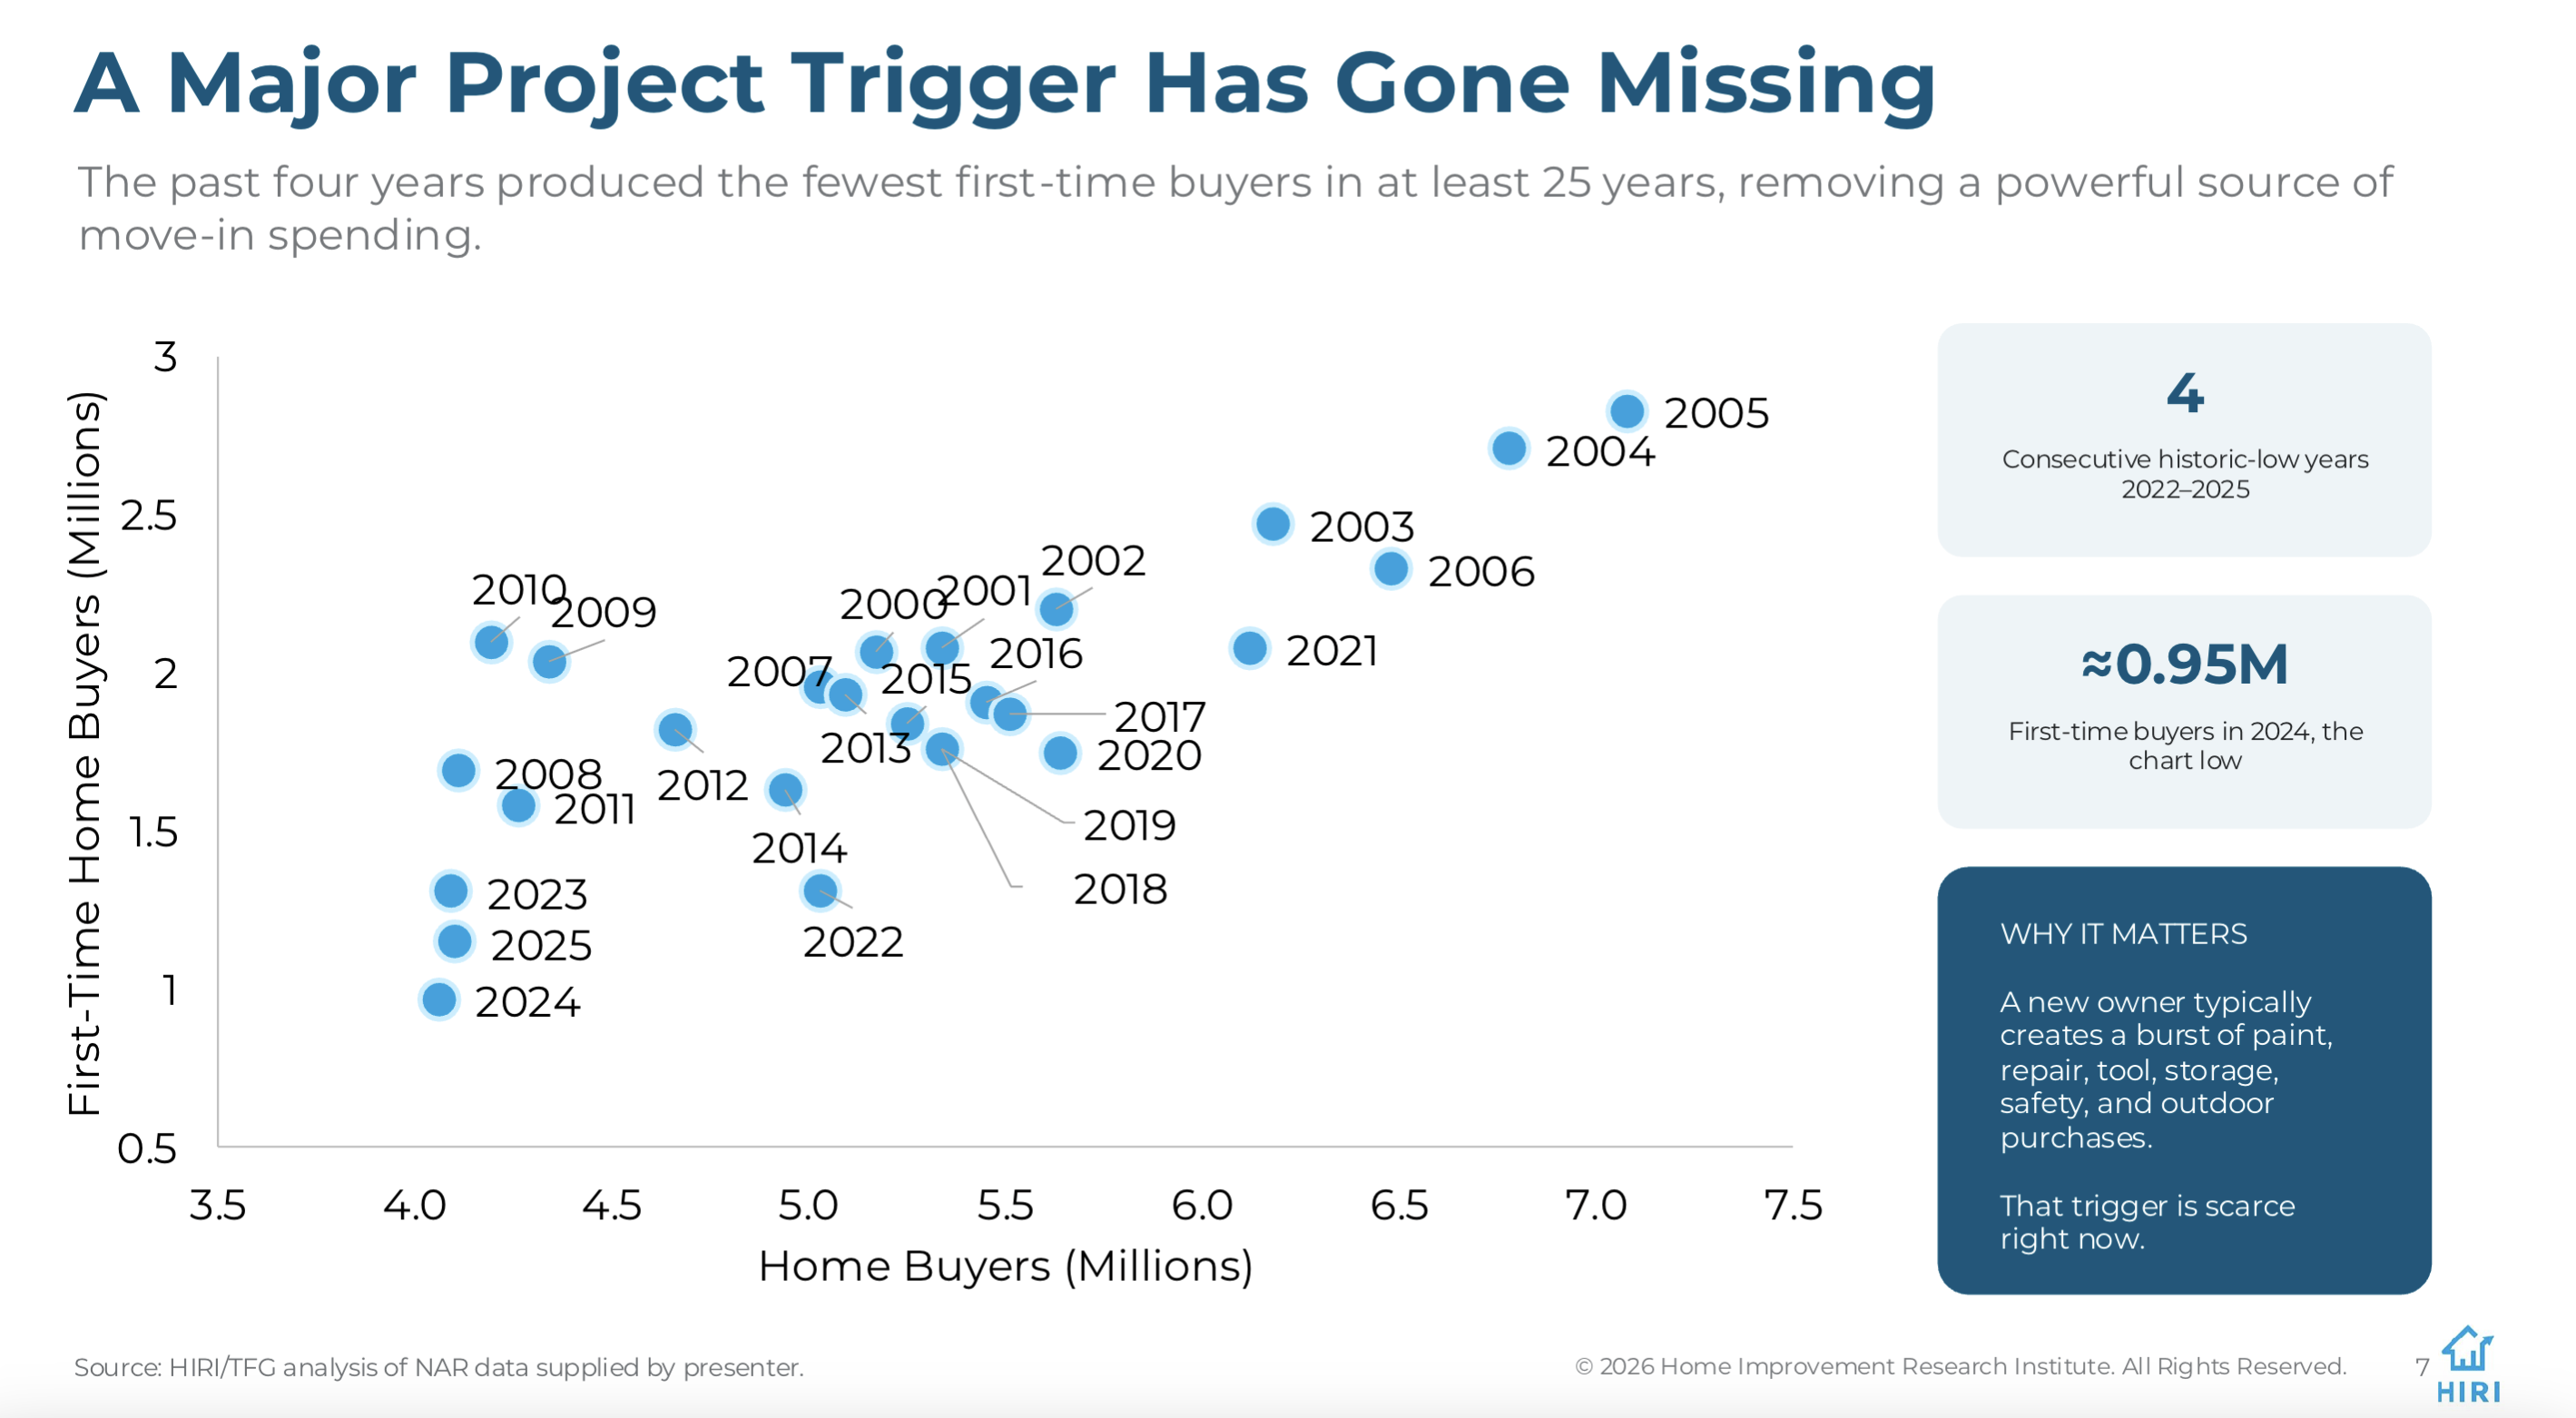
This is significant because a new owner typically engages in a burst of home improvement activity and product purchasing, as they start their collection of tools and outdoor equipment for their first home. That trigger is scarce in 2026.
Fewer Active Households are Spending More
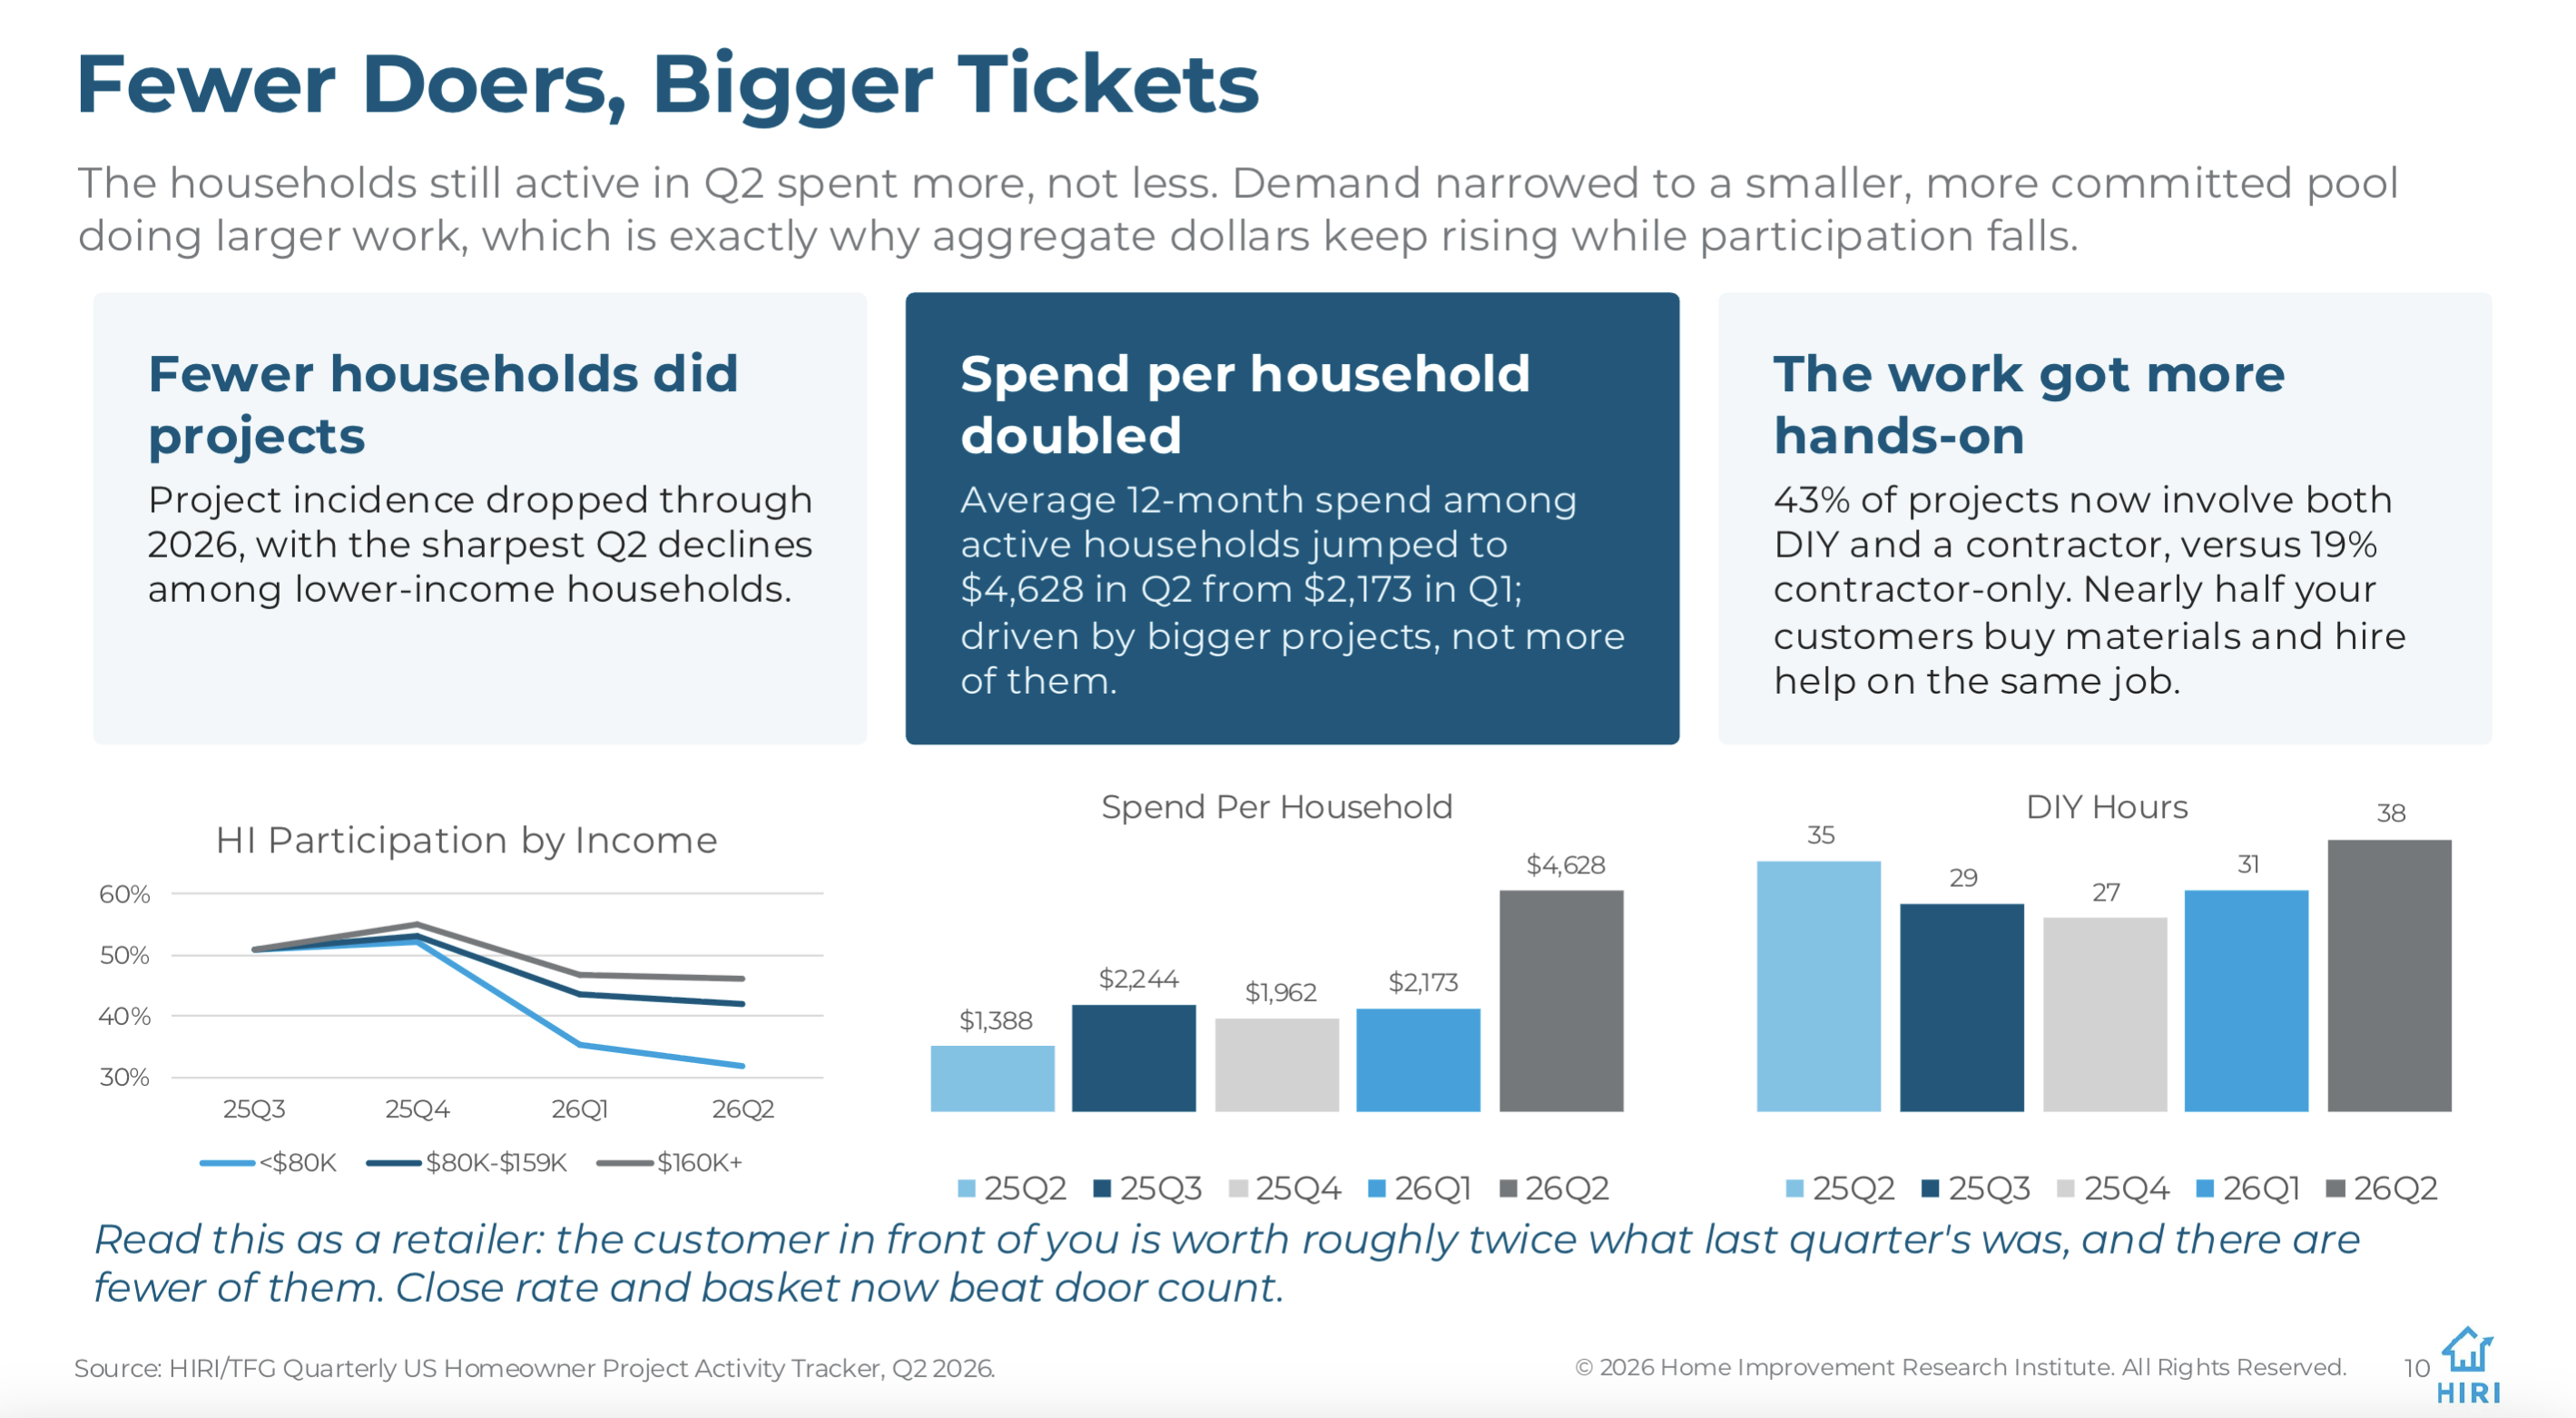
Fewer households participated in home improvement projects in Q2 2026, based on findings in HIRI’s Quarterly U.S. Homeowner Project Activity Tracker. The sharpest decline was among lower-income households, or those making $80K or less. Meanwhile, the average 12-month spending among active households jumped from $2,173 in Q1 to $4,628 in Q2, and up from $1,388 in Q2 2025. This data implies there is a smaller, more committed segment of homeowners undertaking larger or more comprehensive renovations. This concentration of spending among active homeowners can support total market revenue even when overall project participation declines.
Economic Indicators for Building Product Manufacturers to Monitor in 2026
For a clear read on the market, manufacturers should closely monitor several economic indicators, including consumer and contractor confidence, disposable income, inflation, homeowner spending intentions, housing turnover, contractor activity, and inflation-adjusted market growth. HIRI curates relevant data from across trusted industry sources in our Monthly Economic and Industry Update report, made available to all HIRI members.
Why is Disposable Income a Leading Indicator for Future Spending?
Homeowner and contractor sentiment both veered negative in Q2 2026, and homeowners’ planned spending went net-negative, according to HIRI’s Quarterly U.S. Homeowner Project Activity Tracker. When asked how they feel about starting projects:
- 34% said it’s bad time to begin a project $5K or under (up from 26% in Q2 2025)
- 54% said it’s bad time to begin a project $5K to $25K (up from 50% in Q2 2025)
- 66% said it’s bad time to begin a project $5K or under (up from 61% in Q2 2025)
However, the changes in disposable income often provide stronger insight into future building product demand than consumer sentiment alone. Oil-price hikes caused by the Iran War have kept inflation high, pushed out mortgage rate relief to 2027 most likely, and stalled real income growth.
HIRI’s Quarterly U.S. Size of the Home Improvement Products Market Report and Forecast now predicts that real disposable income will grow only 0.5% in 2026, which is a significant drop from the 3.2% predicted in the September forecast when looking out at factors around this time last year. When predicting long-term building-product spend, HIRI’s models show that consumer confidence impacts quarterly data, but disposable income is what moves the trend. With hiring slow, unemployment drifting toward a 4.8% peak in early 2027, and gasoline above $4 a gallon, real income growth is stalling. Households continue to spend, but they prioritize needs first and delay discretionary purchases. Manufacturers and retailers should take this into account when deciding what to stock and promote.
Professional Segment Under Growing Pressure in 2026
Professional customers are under the most real pressure of anyone in the market in 2026. Softer bid volume flowed through the whole contractor funnel in Q2 2026, based on findings in HIRI’s Quarterly Contractor Business Sentiment Tracker.
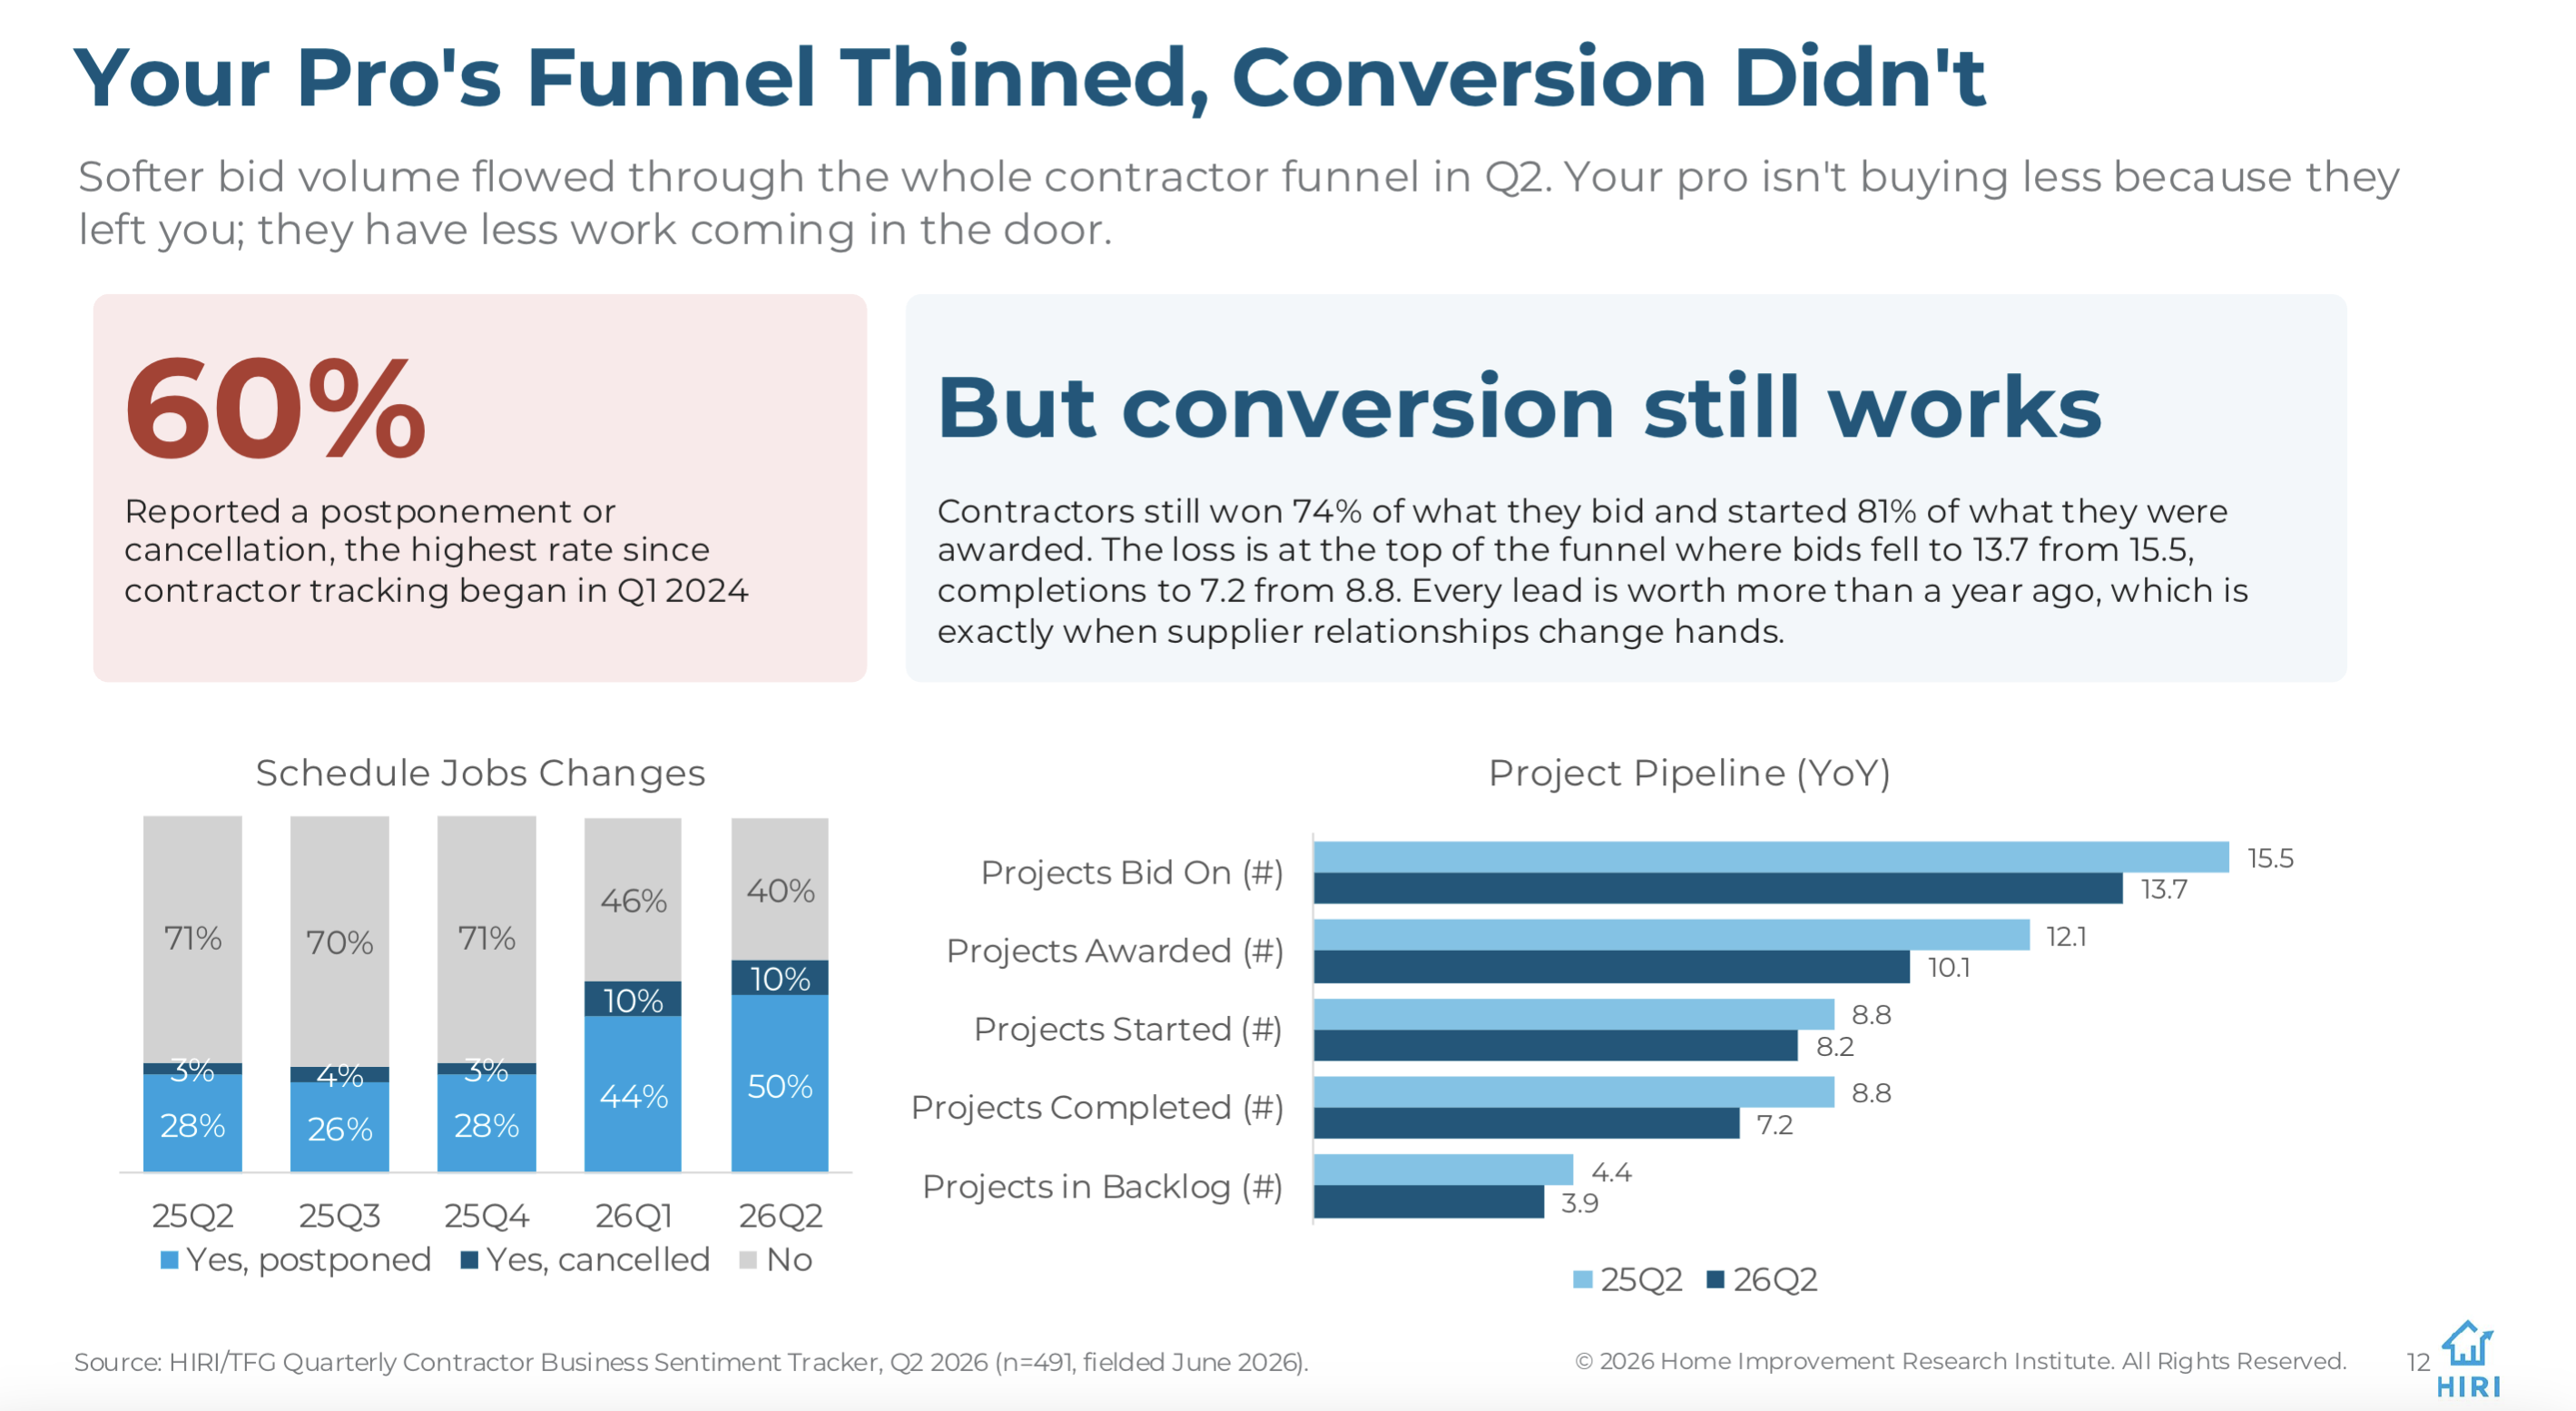
Contractors are also reporting the highest rate of postponed or canceled jobs since contractor tracking began in Q1 2024. For example:
- 60% of contractors had a postponed/canceled job in Q2 2026
- 54% of contractors had a postponed/canceled job in Q1 2026
- 31% of contractors had a postponed/canceled job in Q4 2025
- 30% of contractors had a postponed/canceled job in Q3 2025
- 31% of contractors had a postponed/canceled job in Q2 2024
Additionally, contractors are experiencing lead contraction at the top of the funnel, as
- bids fell to 13.7 in Q2 2026 from 15.5 a year ago
- projects awarded fell to 10.1 from 12.1
- and projects completed decreased to 7.2 from 8.8.
Professional customers simply have less work coming in the door currently.
What is the Long-Term Outlook for Home Improvement Industry
Despite a tempered forecast for 2026, there are several reasons to be optimistic about the long-term health of the home improvement industry in the U.S. The total market is expected to have approximately 2.2% of inflation-adjusted growth per year through 2030, growing from $540 billion in 2026 to $626 billion in 2030, based on HIRI's Quarterly U.S. Size of the Home Improvement Products Market Report and Forecast. Additionally, there are 134.8 million U.S. households (more than double the 1970 base year) and the housing stock in the U.S. continues aging, which in turn leads to repair and remodel projects.
Building Product Categories with the Best Opportunity for Growth
Need-driven categories focused on repair and maintenance have generally demonstrated greater resilience than discretionary remodeling categories. Products supporting essential home maintenance often continue experiencing stable demand even as homeowners postpone larger renovation projects, making category performance an important consideration for manufacturers planning inventory and investment strategies.
Using Data to Get the Real Story on Market Growth for Home Improvement
In light of inflation and other macroeconomic trends, it's important for building products brands to consider both nominal and inflation-adjusted market growth when analyzing the state of the market and using these projections to develop their business strategies. Having nuanced data can also help stakeholders put the current situation into context and identify which trends and drivers have the greatest influence on demand. That's why HIRI exists: to empowering home improvement brand leaders with critical market insights.

HIRI members gain access to over $1 million worth of home improvement market research and industry analysis annually, as well as expert insights. Additionally, our team is here to help support you in utilizing HIRI research to make strategic decisions within your organization. Not yet a HIRI member? Schedule a consultation with Dave King to discuss specific ways HIRI's research would help you.

FAQs
Why does the home improvement market feel slow even when sales figures are growing?
The home improvement market can feel slow because current-dollar sales growth does not necessarily reflect real demand growth. Inflation increases the dollar value of purchases, which can make revenue appear healthy even as unit sales or inflation-adjusted demand decline. Data from the Home Improvement Research Institute shows that the real spend per home is now $892, below the $985 average since 1970. That gap is why a positive forecast still feels flat. It's important for manufacturers and retailers to evaluate both nominal and real growth to better understand actual market conditions.
What is the difference between nominal growth and real growth in the building products industry?
Nominal growth measures market performance using current prices, while real growth accounts for inflation to show changes in actual purchasing activity. For example, the home improvement market is projected to grow approximately 2.6% in current dollars, but that growth in spending is due to increased prices, not additional customers or conversions. When adjusted for inflation, the market is actually expected to shrink by roughly 1.4% in 2026, based on data from HIRI's Quarterly U.S. Size of the Home Improvement Products Market Report and Forecast. For building product manufacturers and retailers, understanding the distinction between nominal and real (inflation-adjusted) growth helps explain why revenue may increase while customer demand or project volume remains flat or declines.
What economic indicators should building product manufacturers monitor in 2026?
Beyond consumer confidence, manufacturers should closely monitor disposable income, inflation, homeowner spending intentions, housing turnover, contractor activity, and inflation-adjusted market growth. The Home Improvement Research Institute (HIRI) curates relevant data from across trusted industry sources in our Monthly Economic and Industry Update report, made available to all HIRI members. Additionally, HIRI research has found that changes in disposable income often provide stronger insight into future building product demand than consumer sentiment alone.
Why are fewer homeowners generating higher home improvement spending?
Mid-way through 2026, fewer households are actively completing home improvement projects, based on findings from the Home Improvement Research Institute's Quarterly U.S. Homeowner Project Activity Tracker. This is due to several factors, such as inflation, economic uncertainty, and budget concerns. However, households that are still activity pursuing home improvement are often undertaking larger or more comprehensive renovations. This concentration of spending among active homeowners can support total market revenue even when overall project participation declines.