
It’s no surprise that consumers of differing ages and in differing life stages have varying preferences and purchase motivations when it comes to selecting home improvement products.
Generational differences can have an effect on all aspects of the purchase journey, from preferred shopping channels to point of purchase considerations and post-purchase brand loyalties. Additionally, there are coinciding factors, including socio-economic status, homeownership rates, and disposable income levels, that influence how homeowners allocate their budgets for home improvement.
What are Key Generational Differences in Homeownership in the U.S. in 2026?
Based on data from the U.S. Census Bureau’s Biennial American Housing Survey and the National Association of Realtors (NAR), included in HIRI's Generational Differences in Home Improvement Activity Report, current homeowners and home sellers are mostly Baby Boomers or older. They also still form the largest percentage of homebuyers, followed by Millennials and Gen X. The report defines homeowner generations using Pew Research Center generational cohorts, which are broken down as:
- Gen Z (ages 18 to 29)
- Millennials (ages 30 to 45)
- Gen X (ages 46 to 61)
- Boomers (ages 62 to 80)
- Silent Generation (ages 81+)
What Percentage of Silent Generation, Boomers, and Gen X Own Homes?
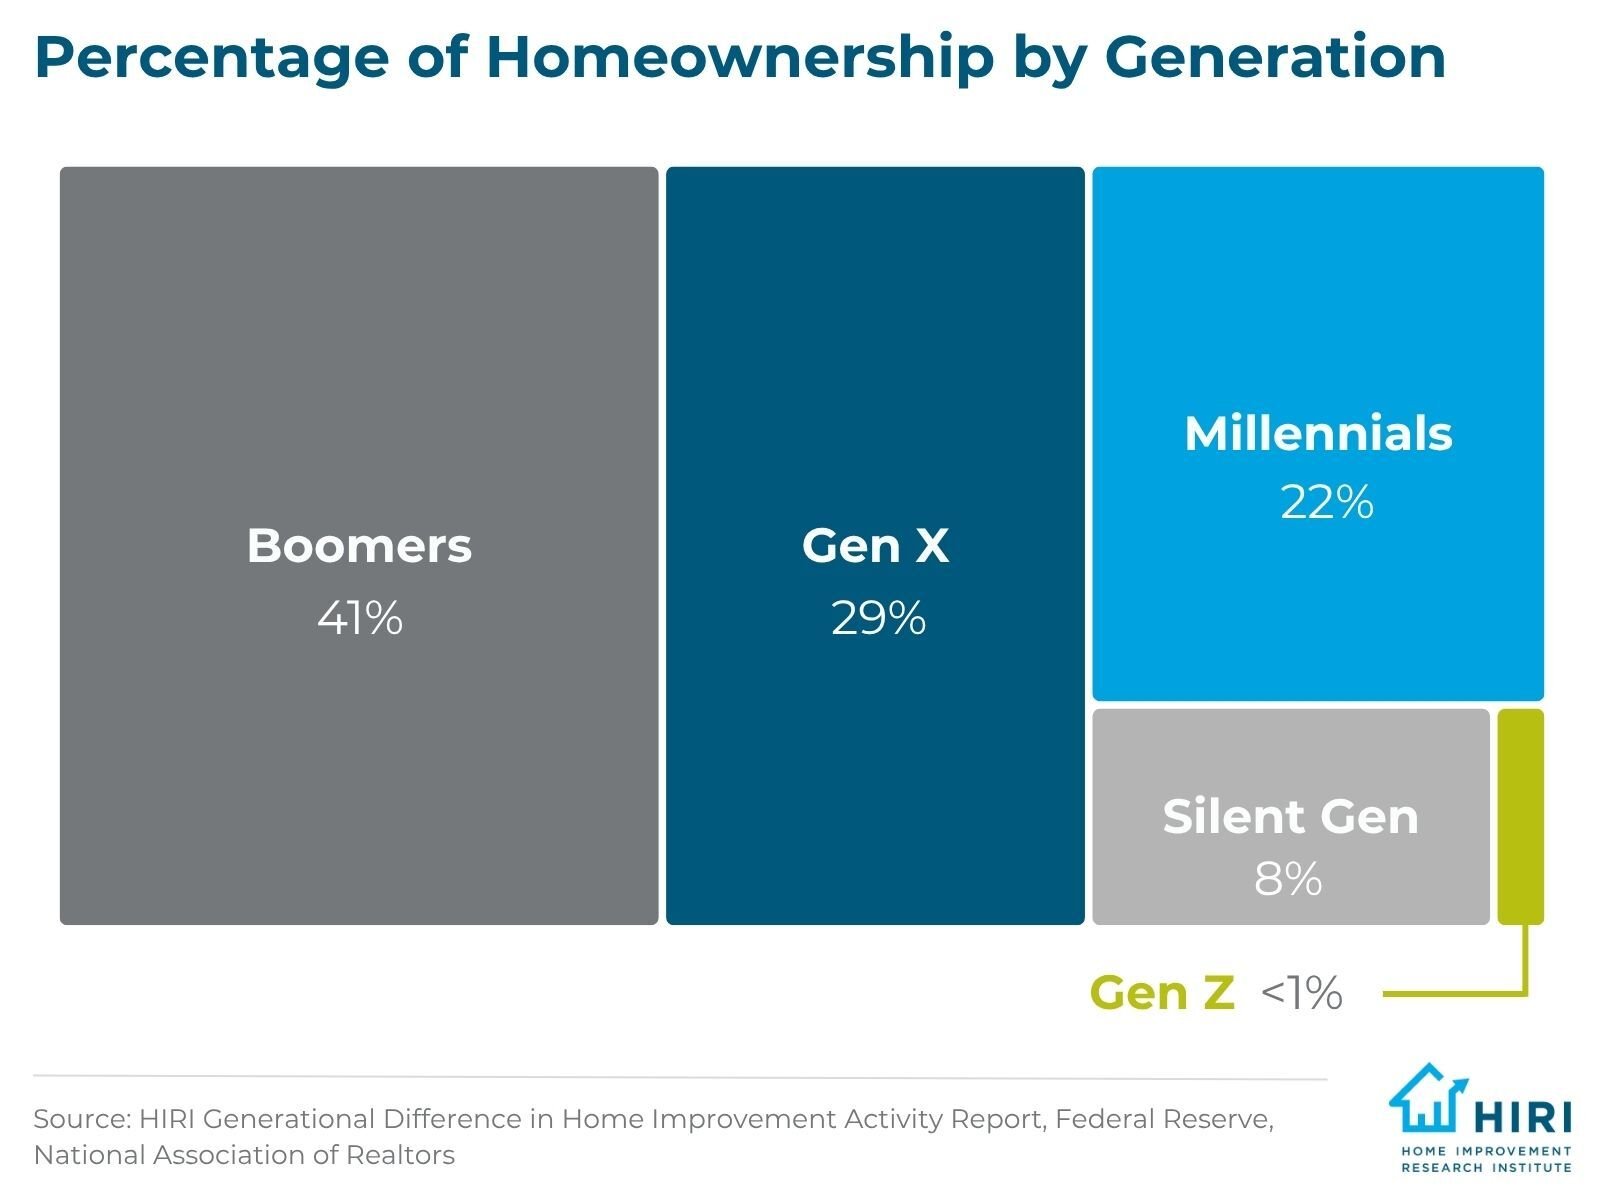
The housing market is still being driven by Boomers and Gen X in 2026. Based on data from the Federal Reserve, the Silent Generation contributes about 8.2% to homeownership, as of Q1 2026. Boomers are the largest segment at 40.7%. Gen X comprises about 29.2% of homeownership in the U.S. Additionally, about 55% of the sellers’ market from July 2024 to June 2025 consisted of Baby Boomers, according to additional data from the NAR included in HIRI's report. They also made up 42% of home buyers during that period, while Millennials comprised roughly one-fourth of home buyers, and Gen Xers contributed another 25%.
What Percentage of Millennials and Gen Z Own Homes?
Millennials are the third-largest group of homeowners in the U.S., as they possess about 21.8% of the inventory. Gen Z is not accounted for in the Federal Reserve’s data, but they will be a more significant factor in the coming years as they approach their late 20s and move into homeownership position.
What is the average age of first-time homebuyers?
The median age for buying a first home in the U.S. just hit 40 years old, based on the NAR’s 2026 Home Buyers and Sellers Generational Trends Report. Many members of the younger generations are having to delay achieving the homeownership milestone as a result of the low housing inventory in the U.S., high mortgage rates, and increasing cost of living. However, Gen Zers may be forging a different path forward, as this survey from Coldwell Banker Real Estate found that about 80% of individuals from that generation are foregoing other major life decisions to be able to afford a home, and many are looking at doing it on their own.
What is motivating Gen Z to buy homes?
When it comes to home buying motivations, according to HIRI’s Generational Differences in Home Improvement Activity Report, younger generations prioritize location, space and equity when acquiring a home. About 52% of Gen Z also see owning a home as more affordable and better investment than renting. About 40% also want to build equity. On the other hand, homebuyers in older cohorts lean more toward implication, downsizing, and lowering their maintenance needs.
How Do Home Renovation Habits Differ by Generation?
HIRI's Generational Differences in Home Improvement Activity Report provides a comprehensive picture of generational attitudes and behaviors towards the means by which home improvement projects are completed, comparing behaviors across all generations, from Millennials to the Silent Generation. Here is a look at some of the key trends that emerged from this analysis:
1. Millennials Lead in Home Improvement Spending
Despite lower levels of home equity and net worth, Millennials lead in annual home improvement spending, as well as project volume, interior work, and blended labor models.
The average spending by generation in the past year is:
- $3,956 for Millennials
- $3,940 for Boomers
- $2,935 for the Silent Generation
- $2,547 for Gen X
- $1,960 for Gen Z
How Do Home Renovation Habits Differ by Generation?
On average, Millennials complete 2.8 home improvement projects, which is the highest volume among the generations based on HIRI's research. Approximately 24% of Millennials do four or more projects per year. Gen Z represent the second-highest average, at 2.5 projects per year, with about 52% of Gen Z homeowners completing 2 projects per year. Gen Z contributes the most DIY hours on projects, or an average of 51, compared to:
- 37 hours by Millennials
- 32 hours by Gen X
- 27 hours by Baby Boomers
- 22 hours by the Silent Generation
Medium-to-large projects show Millennials investing inward, prioritizing interior projects, while Gen Z have focused their larger activity toward outdoor and functional spaces.

2. Gen Z is Becoming Highly Active in Home Improvement
As Gen Zers age into higher rates of home ownership, they’re also contributing more to the home improvement industry. They tend to be highly active, hands-on, and oriented toward adaptable spaces, contributing a significant amount of activity in garages, outdoor areas, permitting, and DIY execution. About 64% reported having completed some type of home improvement activity in the past year (from Q2 2025 through Q1 2026), and they are doing significantly more repairs and renovations than other generations. For example, 88% completed repairs in that period, compared to 69% of all homeowners, and 74% completed renovations, compared to 39% of all homeowners. They are converting homeownership into broader project activity, while older homeowners remain more selective and need-driven.
3. Economic Concerns are Shared Across Generations
Some of the top macroeconomic concerns among U.S. homeowners include the economy, inflation, and personal finances. Worries about the economy have a nearly equal effect on all generations, being noted as a concern by:
- 49% of Gen Z
- 51% of Millennials
- 57% of Gen X
- 50% of Boomers
- 50% of the Silent Generation
Concerns around inflation are also shared among different generations of homeowners, with Gen Z being the anomaly. Inflation was noted as a concern by:
- 23% of Gen Z
- 43% of Millennials
- 43% of Gen X
- 49% of Boomers
- 35% of the Silent Generation
Motivations and barriers still vary sharply by life stage. Repair remains the core need, while Millennials show the broadest appetite for comfort, style, function, value, and contractor-supported home improvement projects. Older homeowners appear more selective, shaped by health, retirement, and practical considerations. Sentiment weakens as project size grows, and younger homeowners report more friction around planning, funding, timelines, knowledge, and contractor access.
4. Energy Efficiency Takes Precedence Over Smart and Sustainable Products
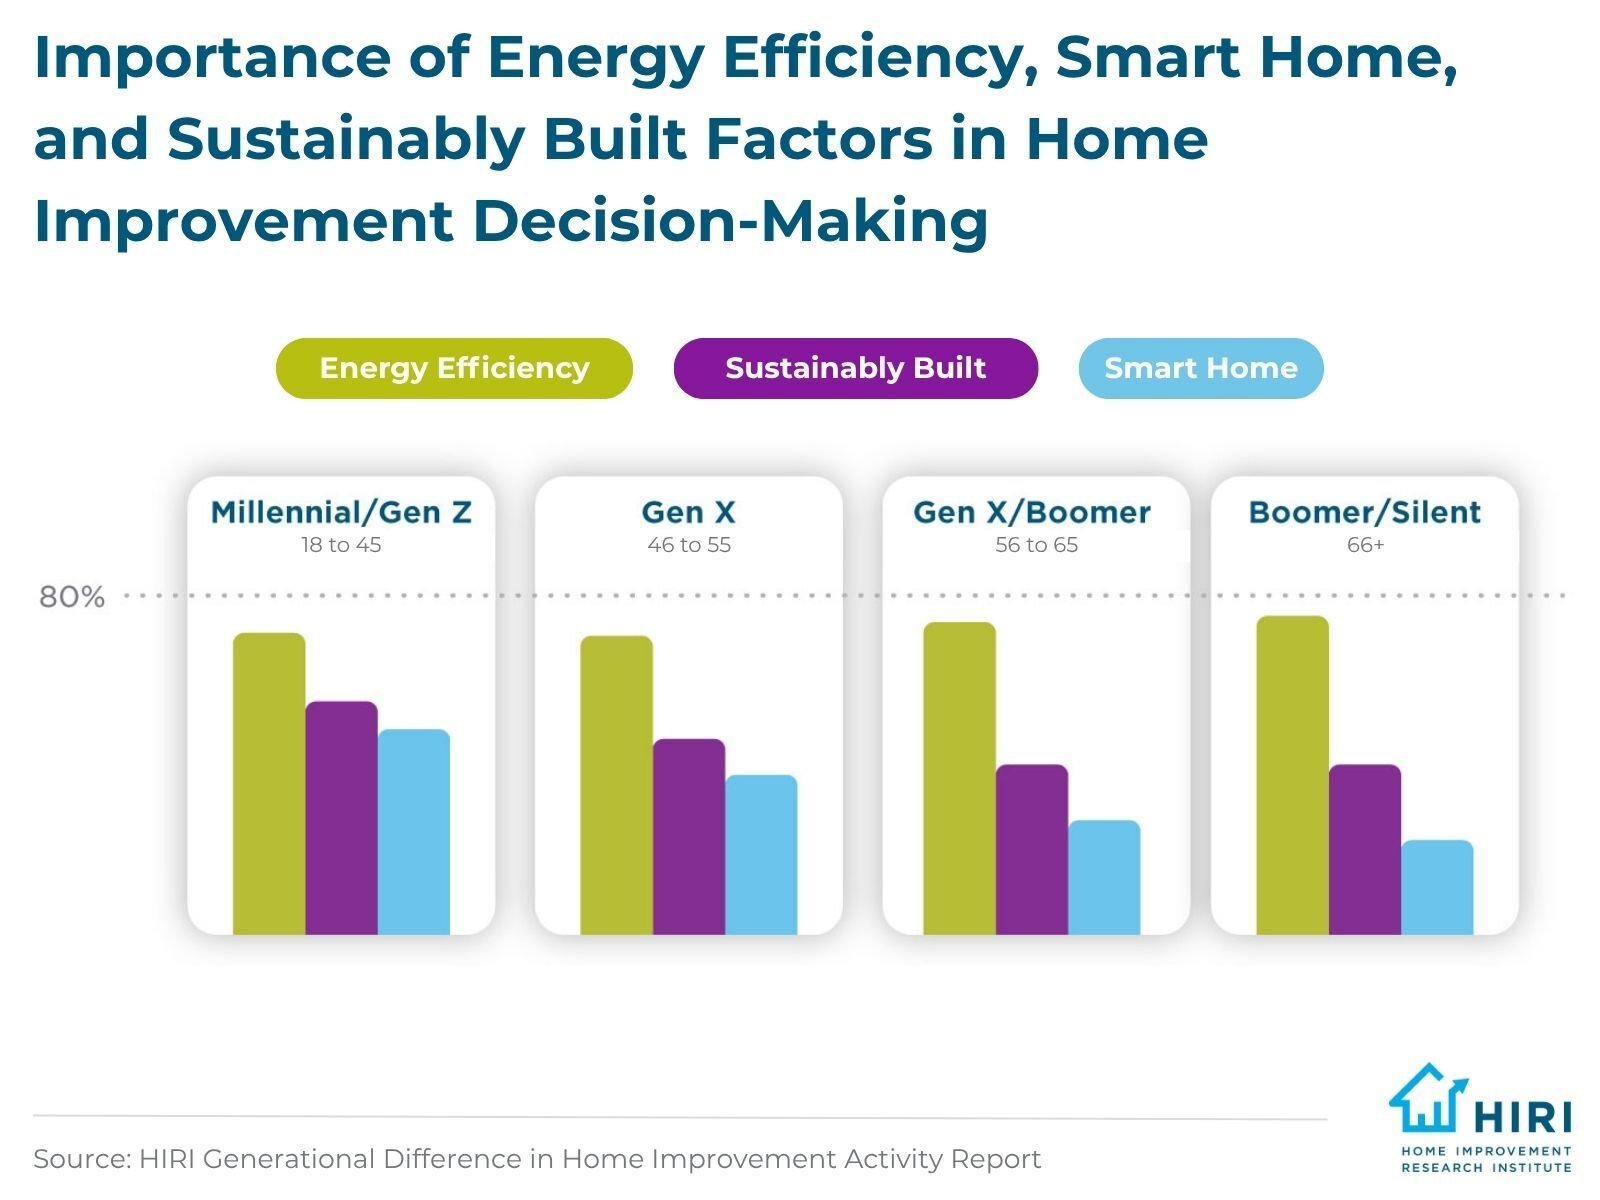
Over the years, homeowners have become more aware about topics like sustainability, energy efficiency, and smart home products, as well as how these concepts interrelate. However, energy efficiency is by and far the most important factor, compared to sustainability and smart home technology, when it comes to home improvement decision-making. According to HIRI’s Smart Home, Energy Efficiency, and Sustainability Studies, energy efficiency influences nearly three-fourths of homeowners in each generation. Selecting sustainably built products is the second most important factor, followed by smart home integration.
Some of the most popular planned energy efficient and renewable upgrades that homeowners are planning for the upcoming year include:
- Energy efficient windows and doors (21%)
- Smart thermostats (21%)
- Insulation (16%)
- Water-saving plumbing fixtures (16%)
- Solar panels (15%)
There are some notable variations in retrofit plans by generation, though. Planning projects for the next year include:
- 85% of Gen Z
- 80% of Millennials
- 68% of Gen X
- 47% of Boomers
The top motivations for energy efficient upgrades include:
- Lowering bills (70%)
- Rising cost protection (36%)
- Home value (35%)
- Replacing equipment (30%)
As cost savings and comforts are the primary motivations, regardless of demographic, for investing in these areas, value messaging will resonate more than eco-consciousness in promoting future energy efficient, smart home, and eco-friendly home improvement products.
5. Younger Generations Demonstrate Flexibility on Shopping Channels
When beginning their shopping journey, homeowners across generations rely on digital sources, including search engines; retailer or manufacturer websites or apps; social media platforms; and AI solutions. About 64% of Gen Z, 60% of younger Millennials, and 55% of older Millennials have started a project specifically because of social media content. YouTube, in particular, is widely used for home improvement project inspiration. Some of the top project influence by social media include:
- Interior painting
- Trees/plants/shrubs
- General landscaping
- Exterior painting
- Outdoor lighting
For actual shopping, big-box stores continue to dominate, utilized by:
- 44% of Gen Z
- 73% of Millennials
- 74% of Gen X
- 69% of Baby Boomers
- 79% of the Silent Generation
However, younger homeowners are more likely to spread their purchasing activity across specialized and alternative channels. More Gen Zers report shopping at local hardware stores and lumber yard of building material dealers than big-box stores. Millennials are also more varied, and they are the most likely to use online-only retailers. They also show a stronger preference for online delivery. Looking ahead, building products brands and retailers should consider implications to their channel strategies should Millennials and Gen Z continue broadening their purchasing channels beyond big-box retail.
6. Millennials Carry Strongest Spending Outlook
In 2026, Millennial optimism about home improvement is likely to sustain ongoing activity. They have the strongest outlook for planned home improvement spending for the next year, reporting planned spending, on average, as follows:
- $8,261 for Millennials
- $7,310 for Gen X
- $5,318 for Boomers
- $5,238 for Gen Z
- $4,912 for the Silent Generation
Gen Z also has broad project intent, capturing the highest interest in interior projects in the upcoming year. However, that intent does not translate into higher spending, which suggests their improvement activity may skew toward smaller, less expensive projects. They are prioritizing renovations, with 61% planning a renovation project in the near future, compared to 25% of all homeowners. Older homeowners were more likely to report focusing on home maintenance or report no plans at all. Additionally, younger homeowners show the broadest near-term purchase intent, especially across exterior, materials, tools, and systems.
7. Aging in Place Trends Contribute to Positive Home Improvement Outlook
Aging in place and multi-generational housing trends are likely to fuel increased home improvement demand in the years ahead. The U.S. Census Bureau estimates that only 10% of American homes are “aging ready,” which means there is ample opportunity within the remodeling market to address this gap. In HIRI's Generational Differences report, aging in place (or mobility needs) was a motivating factor for a recent home improvement project for:
- 62% of Gen Z
- 22% of Millennials
- 13% of Gen X
- 12% of Boomers
- 5% of the Silent Generation
This data suggests that younger owners may read mobility more broadly than aging alone. Younger generations also may be working on projects on behalf of other family members. And development of Accessory Dwelling Units (ADU) is equally common among younger and older homeowners, based on permitting data included in HIRI’s recent Aging in Place Study, which reflects that aging-in-place planning is a multigenerational initiative.
That report also found that homeowners who undertake aging-in-place projects tend to complete more total renovations and spend significantly more, especially in higher-cost tiers, like the $5,000 to $9,999 range and the $10,000 to $24,999 range. Additionally, about 11% of Millennials also had a family member move in last year, and we’re seeing a strong current of multi-generational home buying, fueled by cost savings and the need to care for aging parents. They are likely to drive future home improvement projects to accommodate multiple family units.
Taking Your Home Improvement Products to Market Among Millennials, Gen X, and Baby Boomers
All that said, there are some general principles that building products manufacturers and retailers can apply in your go-to market and advertising strategies to increase market penetration among various generations:
Deploy a Multi-Channel Marketing Strategy to Suit Different Generations' Preferences
As the HIRI data suggests, Millennials especially prioritize getting product information online before purchasing, and Gen X customers find value in conducting online research as well. Meanwhile, younger homeowners are heavily inspired by what they see online and through social media. Manufacturers and suppliers should provide detailed information about how to use their products in applicable projects on their websites and through social media platforms to satisfy pre-project researchers. Manufacturers and retailers can imbue continued confidence in DIY by taking to market products that cater to Millennial and Gen Z's DIY interests and motivate them to take on more projects.
Enhance Online Project Planning Resources
HIRI's findings suggest that age and project planning correlate negatively, with younger generations planning more. With this in mind, home improvement product manufacturers and retailers can offer online resources, such as project tutorials and guides, to assist with planning and organizing. Identify which marketing touchpoints are most attributable to the point of sale and be sure to invest in providing a high-value buyer’s journey at those points to increase market share.
Better Understand Your Home Improvement Product Market
By understanding key generational differences and applying learnings gleaned from insights, home improvement manufacturers can create and market products that appeal to specific age groups while tailoring their marketing and sales strategies accordingly. Want to dig into the full Generational Differences in Home Improvement Activity Report and tabulate the source data specifically for your own use cases? Join HIRI for unlimited access to our full stores of exclusive research.

FAQs
What is the average age for first-time homebuyers?
The median age of first-time homebuyers in the U.S. is currently about 40 years old. In 2025, only 25% of all home buyers were first-time homebuyers, compared to 24% the previous year.
Which generation prefers DIY home improvement?
Based on HIRI's research, Gen Z complete the highest average DIY hours on their projects (51 hours), followed by Millennials (37 hours), and they comprise the largest percentage of advanced DIYers. DIY is the preferred completion method for nearly three-fourths of Gen Zers, followed by 58% of Gen X, while Millennials show a strong tendency toward a hybrid of DIY and contractor work.
Which generation spends the most on home improvement?
Despite lower levels home equity and net worth, Millennials lead in annual home improvement spending, with each successive generations spending less. Additionally, they show the highest intent for increasing home improvement spending in the future.