
Entering the second half of 2026, the home improvement industry is in a state of ambiguity. While many product categories are seeing higher dollar spend, this perceived growth is entirely driven by inflation. When inflation is taken into consideration, product growth is in decline across almost every major category.
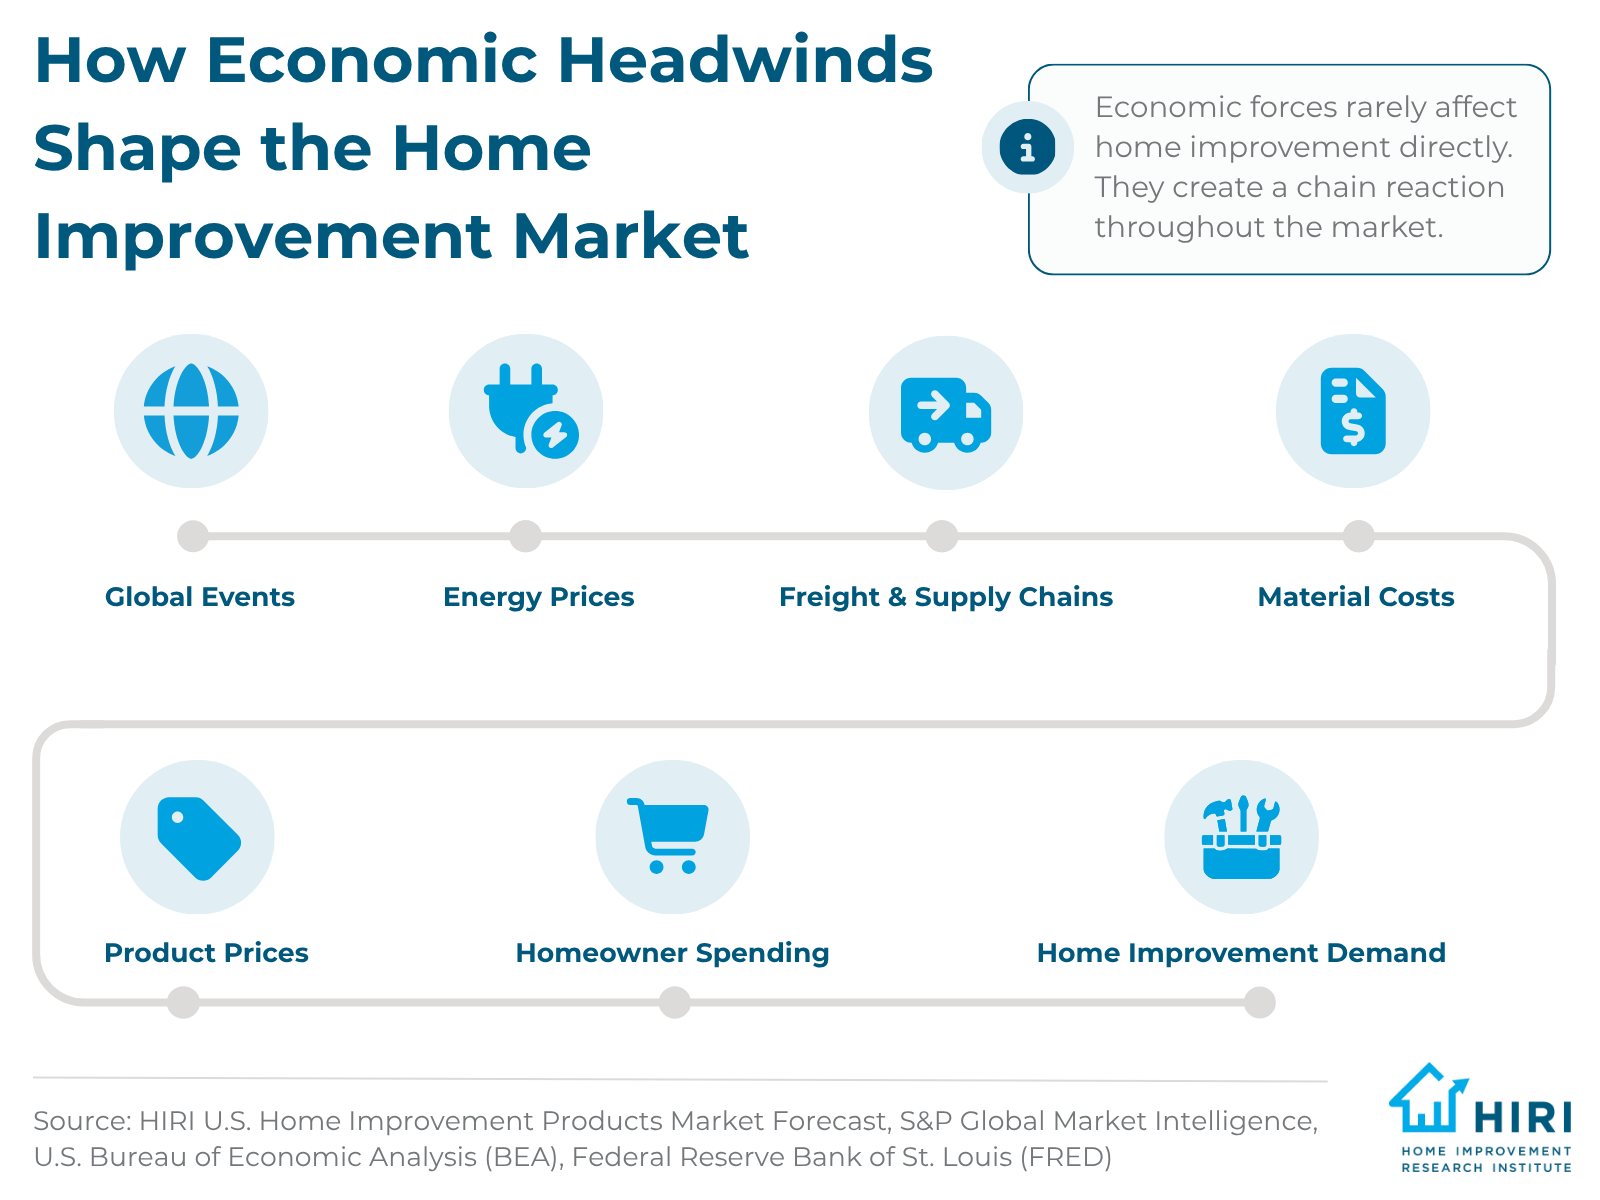
Additionally, the future home improvement spending carries some uncertainty that can be attributed to the potential downstream effects from global conflicts, energy markets, freight costs, supply chains, material pricing, and consumer confidence, according to the Home Improvement Research Institute’s June 2026 iteration of the U.S. Home Improvement Products Market Forecast.
The report offers valuable insights into the state of the industry and the broader economic landscape from 2026 to 2030, which can help manufacturers, suppliers, and other industry stakeholders develop effective business strategies for both the consumer and professional markets.
What is the Home Improvement Products Market Outlook?
An array of macroeconomic indicators influences the home improvement products market, including GDP growth, disposable income, inflation, unemployment, interest rates, consumer confidence, household wealth, payroll gains, and housing activity. The home improvement products market increased slightly in 2025, with more growth on the horizon. The total home improvement market was valued at $526.5 billion last year, according to HIRI's size of market research, and it is projected to grow by an additional 2.6% in 2026. In 2027, the total market is projected to grow by 3.8%, with the professional market growing by 3.9% and the consumer market growing by 3.7%. The market is forecasted to reach approximately $626 billion by 2030, with the consumer market about 1.5 times the size of the professional market.
What Economic Factors Could Impact the Home Improvement Forecast?
Here are a few noteworthy economic trends, explored in-depth in HIRI's Size of Market Report, that will affect the outlook for the home improvement products market and the economy as a whole:
1. Imports and Prices Increase Amid Volatile Trade Policy
Trade policy can influence the real economy and lead below-potential growth in the home improvement market. The trade deficit has improved slightly over the past year as a result of various factors. Real goods imports increased 25.5% in the first quarter of 2026, led by capital goods imports, according to the U.S. Bureau of Economic Analysis via the Federal Reserve Bank of St. Louis. The broad dollar index is projected to decline from its 2026 Q1 level of 119.0 to 117.3 in late 2026 and 115.8 in late 2027. The weakening of the U.S. dollar could impact equity values and raise treasury and private yields.
U.S. Tariffs Produce Lingering Effects
The volatility of the U.S.’s trade policy, particularly in regard to tariffs, has also impacted the economy over the past year or so. In February, the U.S. Supreme Court invalidated the administration's tariffs authorized under the International Emergency Economic Powers Act (IEEPA). The ruling lowered the statutory tariff rate in the forecast, and it is expected that the actual average tariff rate (duties collected as a percentage of non-petroleum imports) will remain below the statutory rate. HIRI projects the average effective tariff rate will settle at 10%.Still, the lingering effects of enacted tariffs are evident. Core goods prices in the Consumer Price Index (CPI) were flat in April but are 1.1% higher over the past 12 months. Broadly, core goods inflation, as measured by the Personal Consumption Expenditures (PCE) price index, remains elevated relative to pre-pandemic norms and contributes to persistently sticky inflation.
2. Iran War Causes Global Instability
The Iran conflict adds a clear downside-risk layer to the home improvement outlook. The U.S. economy entered the second quarter of 2026 on a less firm footing. Prior to the war, consumers were treading water, with spending matching income gains. The most immediate downstream impact to the conflict is not only higher energy prices, but higher non-energy logistics costs, more volatile lead times, and renewed pressure on petroleum-linked inputs such as:
- PVC
- Plastics
- Coatings
- Adhesives
- Other chemical-derived building materials
Additionally, an important development influencing the forecast is an updated projection for oil prices. Oil supplies remain tight, and supply is expected to remain tight enough for long enough to keep oil prices higher.

3. Inflation Across Categories Reduces Discretionary Income that Drives Home Improvement Projects
As a result of the Iran War, consumers are feeling acute pain at the pump. Gasoline prices have soared 27.8% over March and April, and they reflect the immediate effects of surging crude oil prices, driving headline inflation higher. However, the war’s effects are now visible beyond energy categories. Core service prices climbed 0.5% in April, and within core services, rent of primary residence and owner’s equivalent rent both jumped by 0.5%. This was an uptick from gains of 0.2% and 0.3% in March, respectively. The larger rent increases in April were anticipated, stemming in part from a correction in the understatement of the level of shelter costs since October.Based on the Federal Reserve’s PCE Price Index, inflation is forecast to firm from 2.9% over the four quarters of 2025 to a peak of 3.6% over the four quarters of 2026. The higher rate of inflation reflects the pass-through of higher oil prices, which is only partially offset by an assumed lower average tariff rate.
How Does Inflation Affect the Home Improvement Outlook?
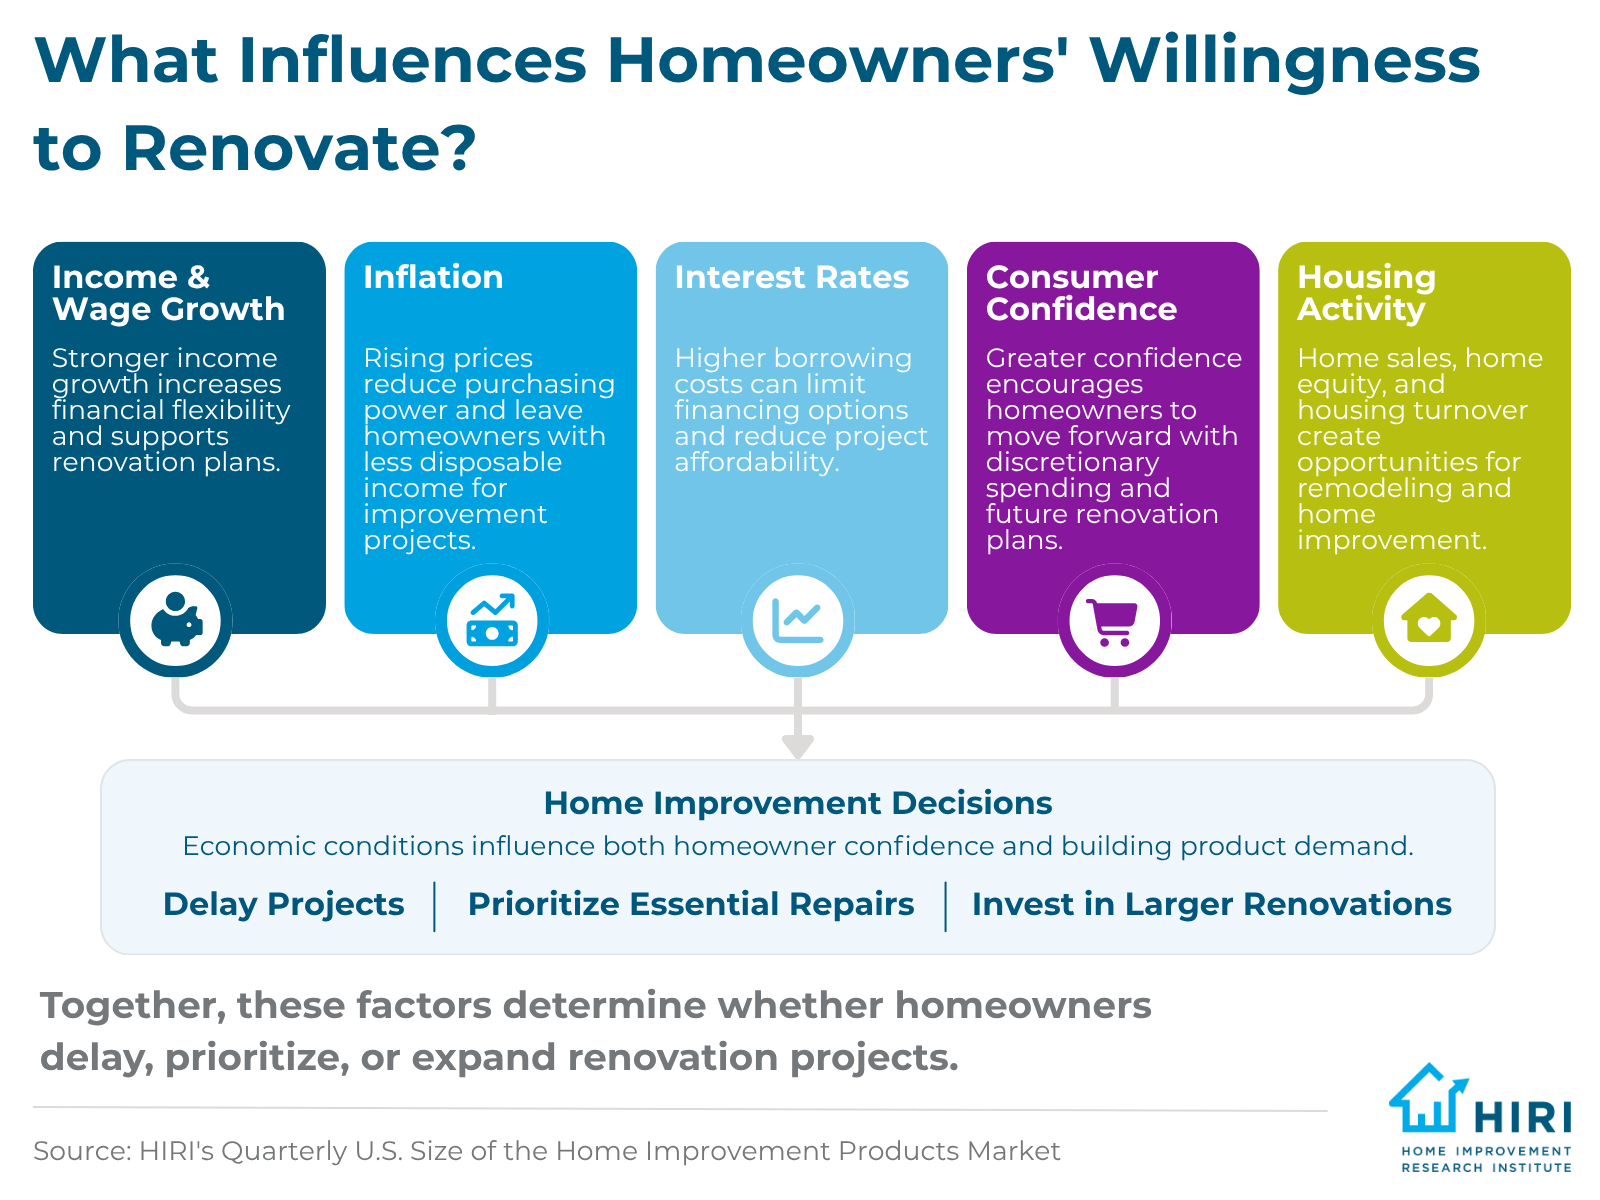
The Federal Reserve is now expected to keep the target range for the federal funds rate at the current level (3.5% to 3.75%) through June of next year, three months later than in last quarter’s forecast. The outlook for Federal Reserve policy, however, remains highly conditional, especially with a new chair at the helm of the system as of July 2026. Not only does inflation drive up materials and labor costs, but it also shifts consumer behaviors and their home improvement activity. Inflation and higher costs decrease their purchasing power and discretionary incomes, putting downward pressure on home improvement projects and product demand as consumers focus on need-based purchases.
4. Personal Income is Holding Against Inflation
For Q1 2026, income growth rose to 3.9%, up from 3.4% in the fourth quarter of 2026, as slower wage growth and declining Affordable Care Act tax credits were offset by larger tax refunds, dividend income, transfer receipts, and farm assistance. Household net worth rose $2.2 trillion in Q4 2025, or 1.2%, to a record $184 trillion, according to data from the Federal Reserve included in HIRI’s Size of Market Report. Data suggests that personal income growth will moderate in 2026 but is helped by recent productivity gains expected to boost hourly pay and low unemployment. Growth of nonmortgage consumer credit also increased in Q1 2026, to a 3.2% annualized rate, up from 2.1% in Q4 2025. While inflation may have contributed to the quarter’s rise, borrowing is still modest compared with growth in consumers’ ability to pay.
Debt-to-Income Balances Indicate Homeowners aren't Facing Widespread Financial Distress
However, borrowing picked up in the first quarter and is expected to rise modestly in 2026. Past wage gains and firming prices may be supporting demand, but consumers are unlikely to extend themselves unless hiring improves. However, there is also little evidence that consumers are facing widespread distress. Relative to income, debt balances are lower than they were before the pandemic, auto loan and credit card delinquencies have slowed, and the transition rate for mortgages, the largest share of household debt, remains low. That said, delinquency rates for student loans rose sharply in Q4 and remain elevated for credit card and auto loans. The added financial strain could spill over into other credit products in the months ahead.
5. Consumer Sentiment Hits New Low
In May, the University of Michigan’s preliminary Consumer Sentiment Index fell to an all-time low. Concerns around kitchen-table issues persist, but current attitudes are hostage to the war with Iran and the rise in gasoline prices. The decline in buying plans for big-ticket items, cars and household durables is no surprise. The gap between what consumers do and say, however, remains. While many households express financial struggle, those frustrations have yet to spillover significantly into outlays. This concept of “following their wallets” drove consumer spending in 2025 and, for now, appears to be holding in 2026. The impacts of macroeconomic and geopolitical factors on consumers versus professionals are also varied, which is why HIRI's Size of Market Reporting analyzes these customer segments separately.
What is the 2026 Outlook for the Consumer Market?
The U.S. economy entered the second quarter of 2026 on a less firm footing. Prior to the war, consumers were treading water, with spending matching income gains. Real PCE rose 1.6% at an annual rate in Q1 2026, down from 1.9% in Q4 2025, as past swings in policy continue to affect growth.
Real Disposable Income Stagnates
While consumers will eventually economize, they will initially pay higher prices. Especially as personal income picked up in March, helped by a recovery in wages and salaries, up 0.4% and 4.1% higher than a year ago. For the quarter, income growth rose to 3.9%., although real disposable personal income ticked down in March and was up a lackluster 0.4% from a year earlier, lowering the personal saving rate to 3.6%. According to HIRI's research, real disposable income is projected to grow by 3.2%, and real personal consumption expenditures by 2.8% this year.
Home Sales Pick Up in Forecast
Based on data from S&P Global Market Intelligence, including HIRI's report, existing home sales are expected to bounce back from 4.08 million in 2025 to 4.22 million in 2026 and 4.61 million in 2027 as homes become more affordable due to lower mortgage rates, lower prices, and rising income. The projected uptick in home sales is indicative of consumer confidence and the health of the economy, which both impacted product-purchasing behaviors. Overall, consumer market sales are expected to pick up by 3.7% in 2026 to $325.16 billion, with growth averaging approximately 3.1% from 2027 to 2030.
What is the 2026 Outlook for the Professional Market?
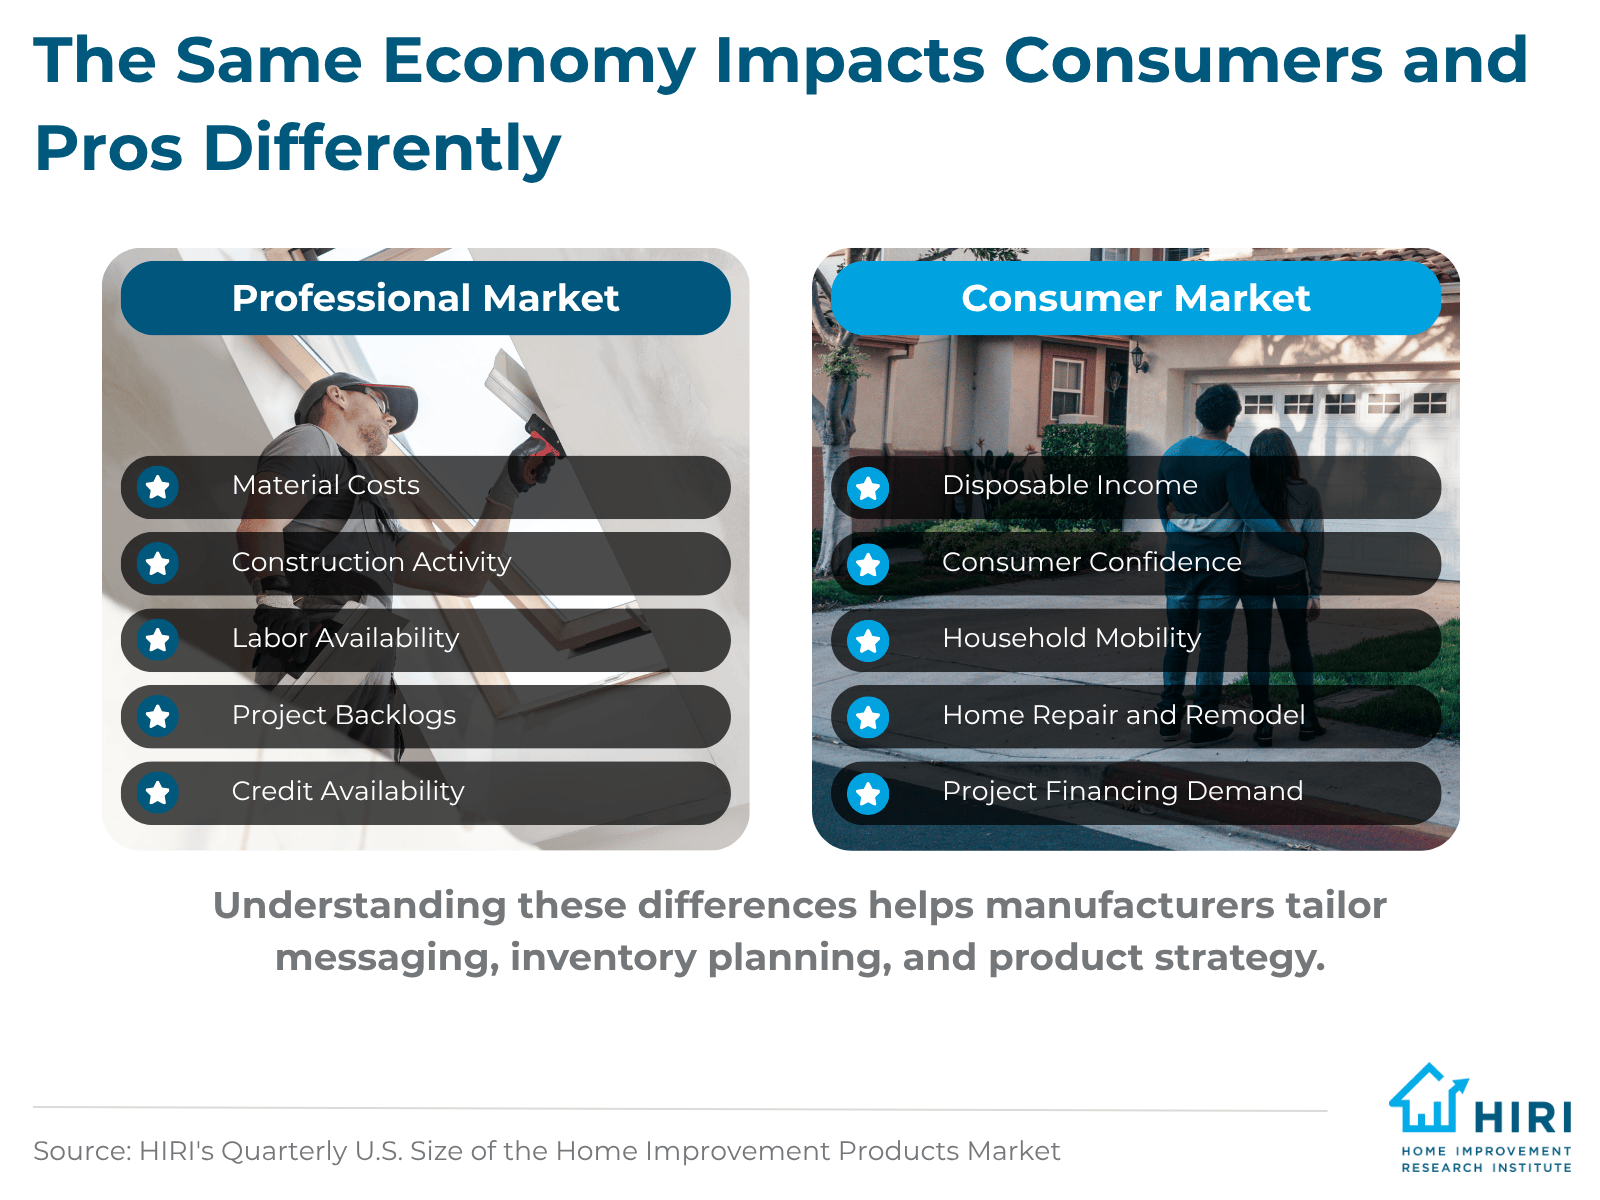
Looking forward, HIRI’s forecast data shows that overall home improvement product sales for the professional market are likely to remain at roughly the same level through the end of 2026 into 2027. The study provides forecasts for contractor-driven spending and examines the factors affecting professional demand, including residential improvement investment, material costs, and construction activity.
Lock-In Effect Persists, Limiting Supply of Starter Homes
According to data from the Federal Housing Financing Agency (FHFA), included HIRI's Size of Market Report, 67.4% of the 51.6 million outstanding mortgages carried rates below 5%, with nearly 20% under 3%. In contrast, today’s 30-year fixed mortgage rate is 6.4%. Homeowners with low-rate mortgages are effectively “locked in,” which discourages upgrades and limits the supply of starter homes as current owners stay put. The result is higher rents, reduced labor mobility, and persistently low inventory and home sales, and this lock-in effect is expected to continue for many years.
Housing Market Begins Slow Recovery
While the U.S. housing market is in the early stages of recovery, these continue to be rocky times for builders. They are cutting prices even as their costs are rising, squeezing profits. Additionally, deportations are reducing the supply of workers and raising wages, while tariffs have increased the prices of lumber, steel and aluminum (which have jumped since the Iran War started in February 2026). Still, while HIRI's forecast shows housing starts dipping from 1.36 million in 2025 to 1.35 million in 2026, they are expected to reach 1.29 million by 2029.
Housing Affordability Affects Sales Activity
The monthly mortgage payment used to calculate the Housing Affordability Index increased 3.8% to $2,115. Adjusted for inflation, the monthly payment is 60% higher than five years ago. However, affordability is slowly improving. The National Association of Realtors' affordability index was 110.6 in April, up from 101.4 a year earlier (A higher number means housing is more affordable). As the annual increase in house prices slows down, home sales will rebound in the forecast period.
Professional Market Outlook for Building Products
Professional market sales in home improvement are expected to grow by 1% in 2026 and by 3.9% in 2027, averaging 4.2% annually from 2027 to 2030. Most building product categories in the professional market are projected to grow between approximately 1.8% and 2.9% from 2026 to 2030, with the highest gains in nursery stock and soil treatments; tools; hardware; and lawn and garden equipment and supplies.
What Merchandise Lines are on the Rise in 2026?
HIRI's U.S. Home Improvement Products Market Forecast forecasts growth and/or declines across 21 building product categories, for both consumer and professionals combined, based on their projected compound annual growth rates (CAGR) from 2026 to 2030. These insights can help you identify which categories are expected to outperform the broader market over the forecast period and align your product offerings and inventory levels with current and future market demand.
Top-Growing Building Product Categories
In 2026, the building product categories with the highest CAGR include:
- Windows, skylights, and patio doors
- Plumbing supplies
- Hardware
- Tools
Looking ahead, here are the categories forecasted with the highest CAGR in 2026 to 2030:
- Roofing and supplies
- Hard-surface flooring coverings
- Soft-surface floor coverings
- Gypsum and specialty boards
- Insulation and weatherization products
- Paint and preservatives
HIRI members have access to the full report and other proprietary research, with detailed projections across building product categories for both consumers and professionals.
Planning for the Future in the Home Improvement Market
The home improvement products market is quite sensitive to the health of the housing sector, as well as to basic indicators of consumer demand, such as real income and relative prices. To help product manufacturers and suppliers plan for both best- and worst-case scenarios, HIRI's U.S. Home Improvement Products Market Forecast provides forecasting models that take into account two alternatives in terms of consumer demand and housing market variables. It also contains geographic detail for the nine census divisions, showing economic growth and slow-down rates, as well as future forecasts by region. For full access to the report and other proprietary research, become a member of HIRI.

FAQs
How do consumer and professional markets compare?
In terms of dollar value, the consumer market is about 1.5 times larger than the professional market for home improvement products. The professional market grew much faster from 2020 to 2025, whereas the consumer market is forecast to have a higher compound annual growth rate (CAGR) in 2026, according to data from the Home Improvement Research Institute’s U.S. Home Improvement Products Market Forecast. Both the consumer and professional segments of the home improvement products market are projected to have comparable CAGR in 2027. HIRI’s report breaks down the data by homeowners and professionals, providing insight into the relative size, growth trajectory, and long-term outlook of each market segment.
Which building product categories are expected to grow the fastest?
The building product categories that are expected to grow the fastest from 2026 to 2030 include roofing and supplies; soft-surface floor coverings; hard-surface floor coverings; paint and preservatives; gypsum and specialty boards; insulation and weatherization products; and doors and molding, according to the Home Improvement Research Institute’s U.S. Home Improvement Products Market Forecast. The report includes historical and projected growth rates across 21 building product categories, illustrating which ones are expected to perform best in both the professional and consumer segments of the home improvement market.
How fast is the home improvement products market expected to grow?
The home improvement products market is showing signs of resilience, and even steady growth across many product categories, in the upcoming forecast period, from 2026 to 2030. The market is expected to reach approximately $626 billion by 2030, with the consumer market about 1.5 times the size of the professional market, according to the Home Improvement Research Institute’s U.S. Home Improvement Products Market Forecast. However, the market is significantly tied to a variety of economic indicators, such as GDP growth, disposable income, inflation, unemployment, interest rates, consumer confidence, household wealth, payroll gains, and housing activity. HIRI’s research includes details on how fast the overall home improvement products market is expected to grow, providing both current-dollar and inflation-adjusted outlooks through 2030, as well as the compound annual growth rates (CAGR) of individual building product categories.
What impact could geopolitical instability have on the home improvement market forecast?
The Iran conflict and accompanying geopolitical instability add a clear risk layer to the home improvement market forecast. The most immediate downstream impact to the conflict is not only higher energy prices, but higher non-energy logistics costs, more volatile lead times, and renewed pressure on petroleum-linked inputs such as PVC, plastics, coatings, adhesives, and other chemical-derived building materials, according to the Home Improvement Research Institute’s U.S. Home Improvement Products Market Forecast. Additionally, oil supplies remain tight, and supply is expected to remain tight enough for long enough to keep oil prices well above recent levels. HIRI’s research shows that prolonged geopolitical instability is likely to create cost and margin pressures, while simultaneously increasing the risk that consumers delay discretionary renovation projects.