
Edit

July 14, 2026

Home Improvement Project Activity Tracker - 2026 Q2

Edit

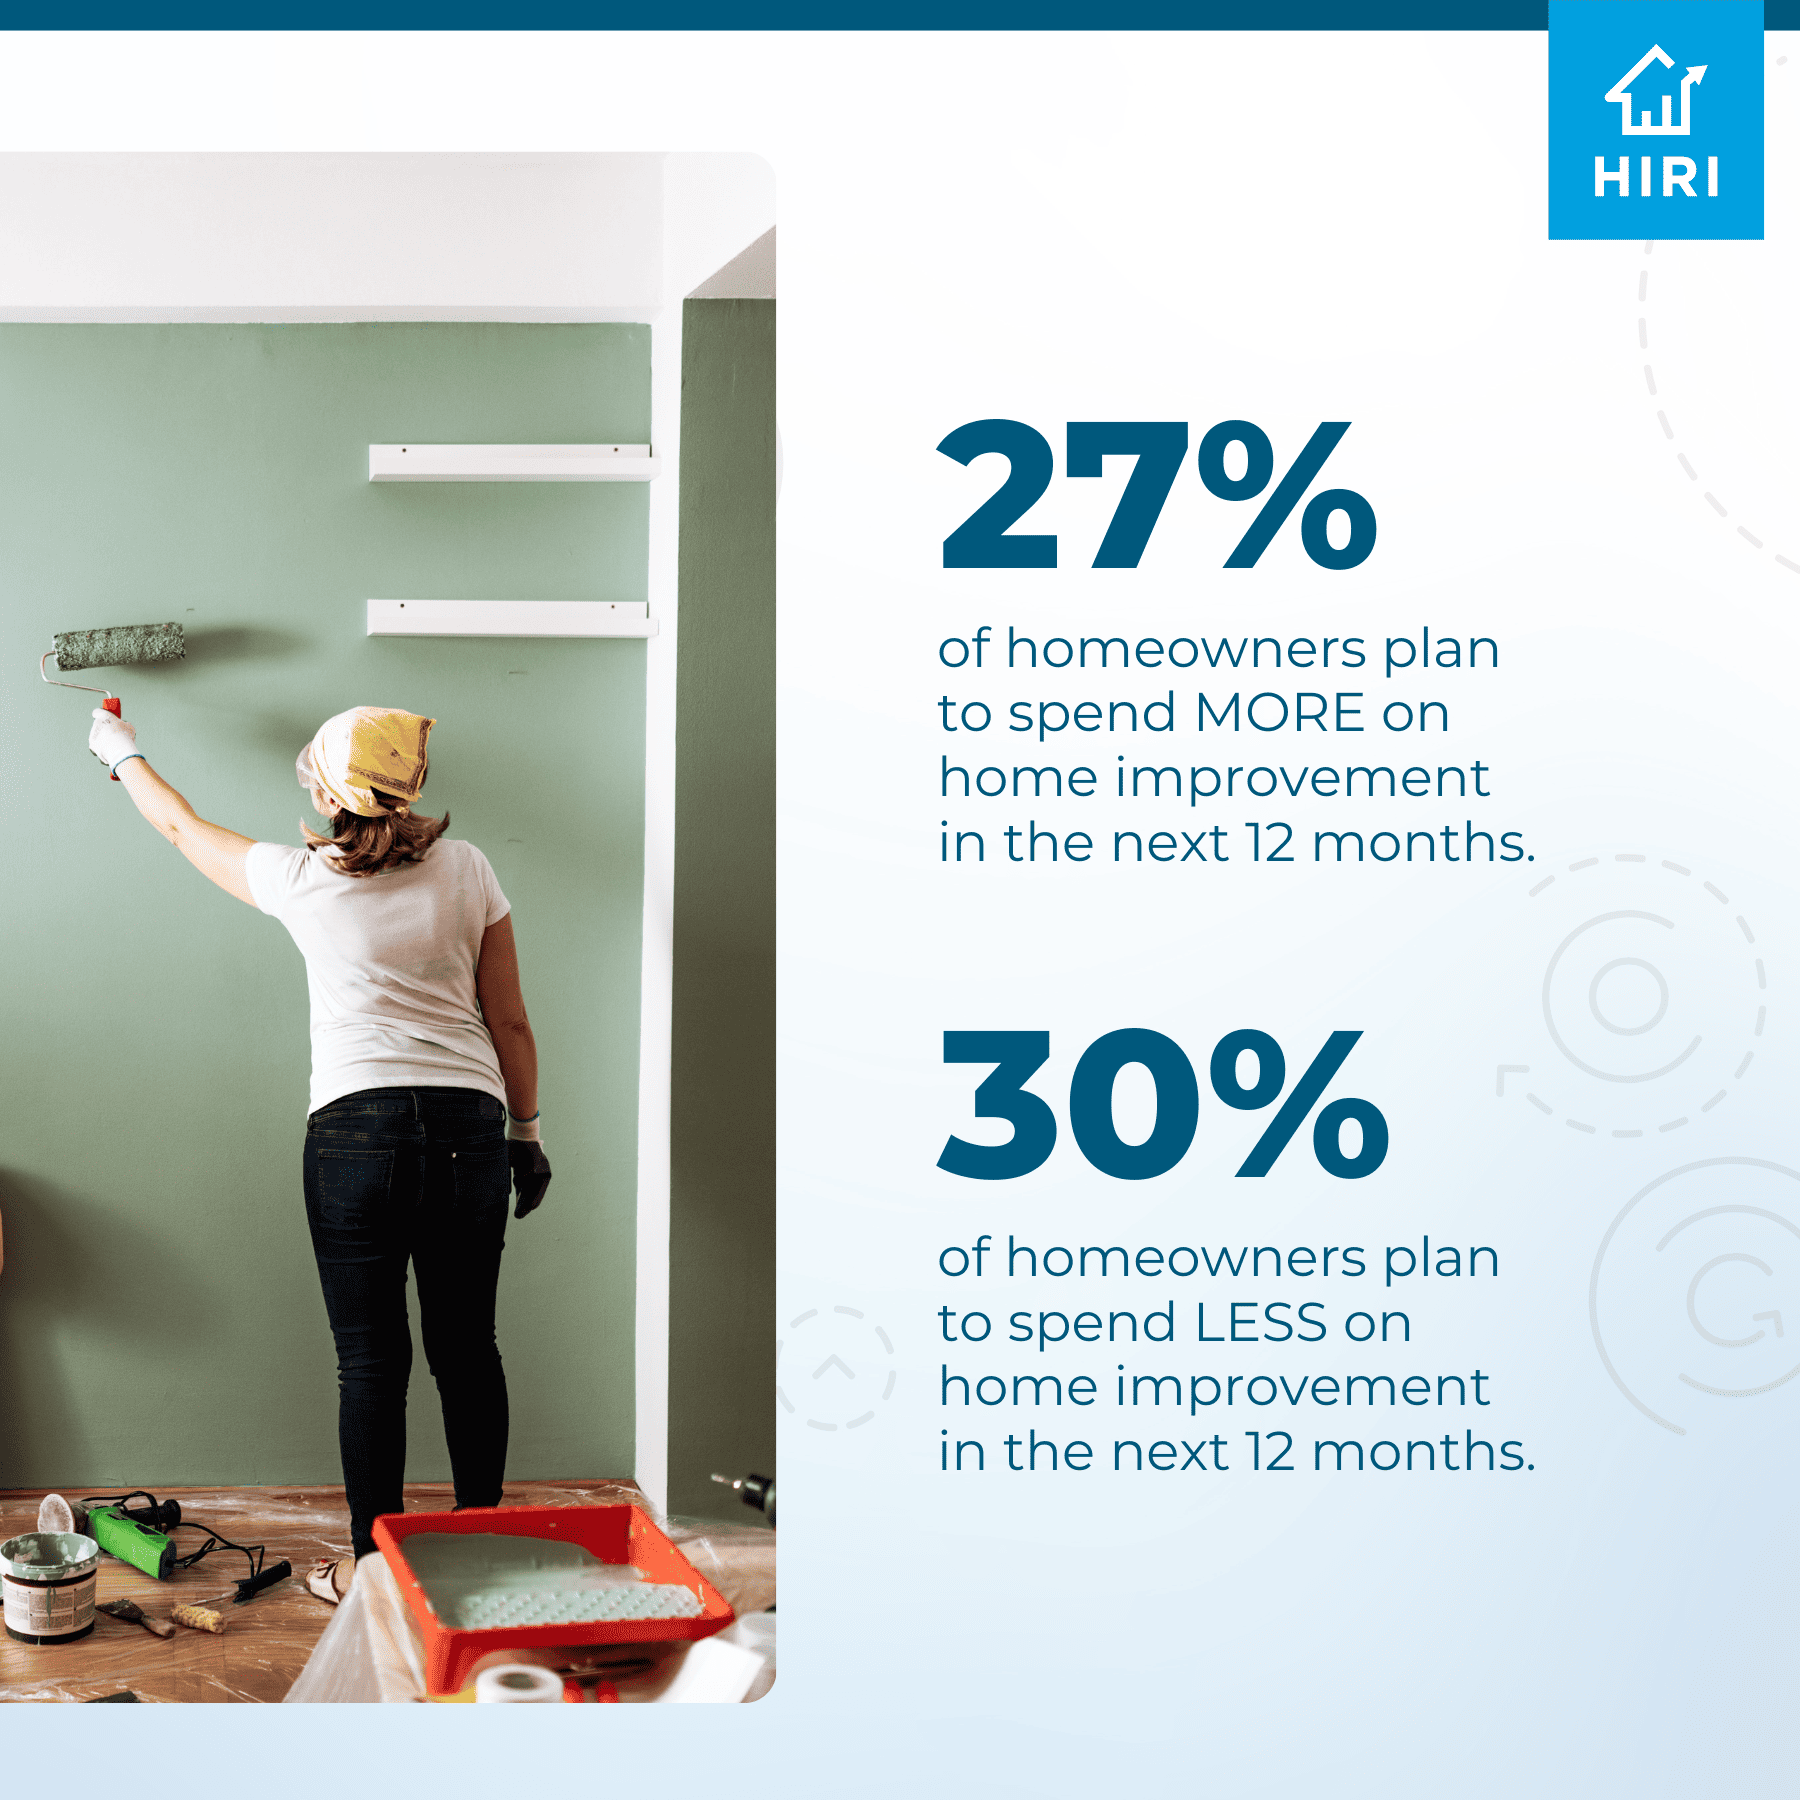
Homeowners flip negative on planned spending, as 30% plan to spend less on home improvement.

Households turned negative on home improvement spending for the first time in five quarters. 30% of homeowners now plan to spend less on home improvement over the next 12 months, versus only 27% who plan to spend more. This represents a reversal from Q1's even split.

Average home improvement spend nearly doubled this quarter, even as fewer homeowners took on projects.

Only 38% of homeowners completed a home improvement project in the last 90 days, the lowest share in five quarters. Simultaneously, average spend among those active households nearly doubled in a single quarter.

Homeowner caution deepened across all project cost categories this quarter.

Sentiment worsened across all project cost categories in Q2. For projects under $5,000, more homeowners called it a bad time to start than a good time for the first time in five quarters, 34% versus 32%. The $5,000 to $25,000 bracket posted a four percentage point increase in negative sentiment. Positive sentiment toward $25,000-plus projects softened, decreasing by a three percentage points.

27% of homeowners have now received a quote for a project that has not started yet, a statistically significant increase.

Even as fewer homeowners started new projects this quarter, more pushed further into the planning pipeline. Quote requests rose from 17% to 20%, and that momentum carried through to an actual bid for a growing share of households, a clear sign of progress.

28% of homeowners now have no home improvement project planned for the next year, a five-quarter high.

The share of homeowners planning no project of $5,000 or more over the next year climbed to a statistically significant five-quarter high this quarter, rising four percentage points.

Under­stand­ing the dynam­ic land­scape of home improve­ment is cru­cial for busi­ness­es and researchers alike. This study aims to gain insight into home­own­ers’ atti­tudes and moti­va­tions dri­ving home improve­ment ini­tia­tives, shed­ding light on the recent activ­i­ties they have under­tak­en with­in the last 90 days and planned activ­i­ties in the next 90 days. You will see detail on project activ­i­ty by areas of the home, prod­uct cat­e­gories pur­chased, where prod­ucts were pur­chased and more.

Objectives

Gain insight into home­own­ers’ atti­tudes and moti­va­tions dri­ving home improve­ment initiatives.
Inves­ti­ga­tion of recent home improve­ment activ­i­ties con­duct­ed with­in the last 90 days.
Ana­lyze evolv­ing chan­nel behav­iors over time in home improve­ment practices.
Delve into research pat­terns and influ­en­tial fac­tors shap­ing project and prod­uct pur­chas­ing decisions.
Under­stand the rea­sons why home­own­ers did not under­take home improve­ment activ­i­ties in the last 90 days.
Antic­i­pate future home improve­ment endeav­ors by under­stand­ing home­own­ers’ project intentions.

Past Iterations

HIRI Quarterly US Homeowner Project Activity Tracker PPT Report Q2 2026
HIRI Quarterly US Homeowner Project Activity Tracker PDF Report Q2 2026

Research Files

Cross Tabulations

HIRI Quarterly US Homeowner Project Activity Tracker Crosstab 1 Demographics Q2 2026
HIRI Quarterly US Homeowner Project Activity Tracker Crosstab 2 Contractor BLDG Products Permit Q2 2026
HIRI Quarterly US Homeowner Project Activity Tracker Crosstab 3 Recent Homebuyer DIY Skills EMP Q2 2026
HIRI Quarterly US Homeowner Project Activity Tracker Crosstab 4 Spend Income Net Worth Education Q2 2026
HIRI Quarterly US Homeowner Project Activity Tracker Crosstab 5 Home Value Sq Ft Mort Rate Q2 2026
HIRI Quarterly US Homeowner Project Activity Tracker Crosstab 2 Summary by Qtr Q2 2026

Data File(s)

HIRI Quarterly US Homeowner Project Activity Tracker SPSS File Q2 2026
HIRI Quarterly US Homeowner Project Activity Tracker Detailed Data File Q2 2026

Related Research

Not a Member Yet?
Create a Free Account to Explore Our Other Resources