
How Financing is Shaping Home Improvement Decisions [INFOGRAPHIC]
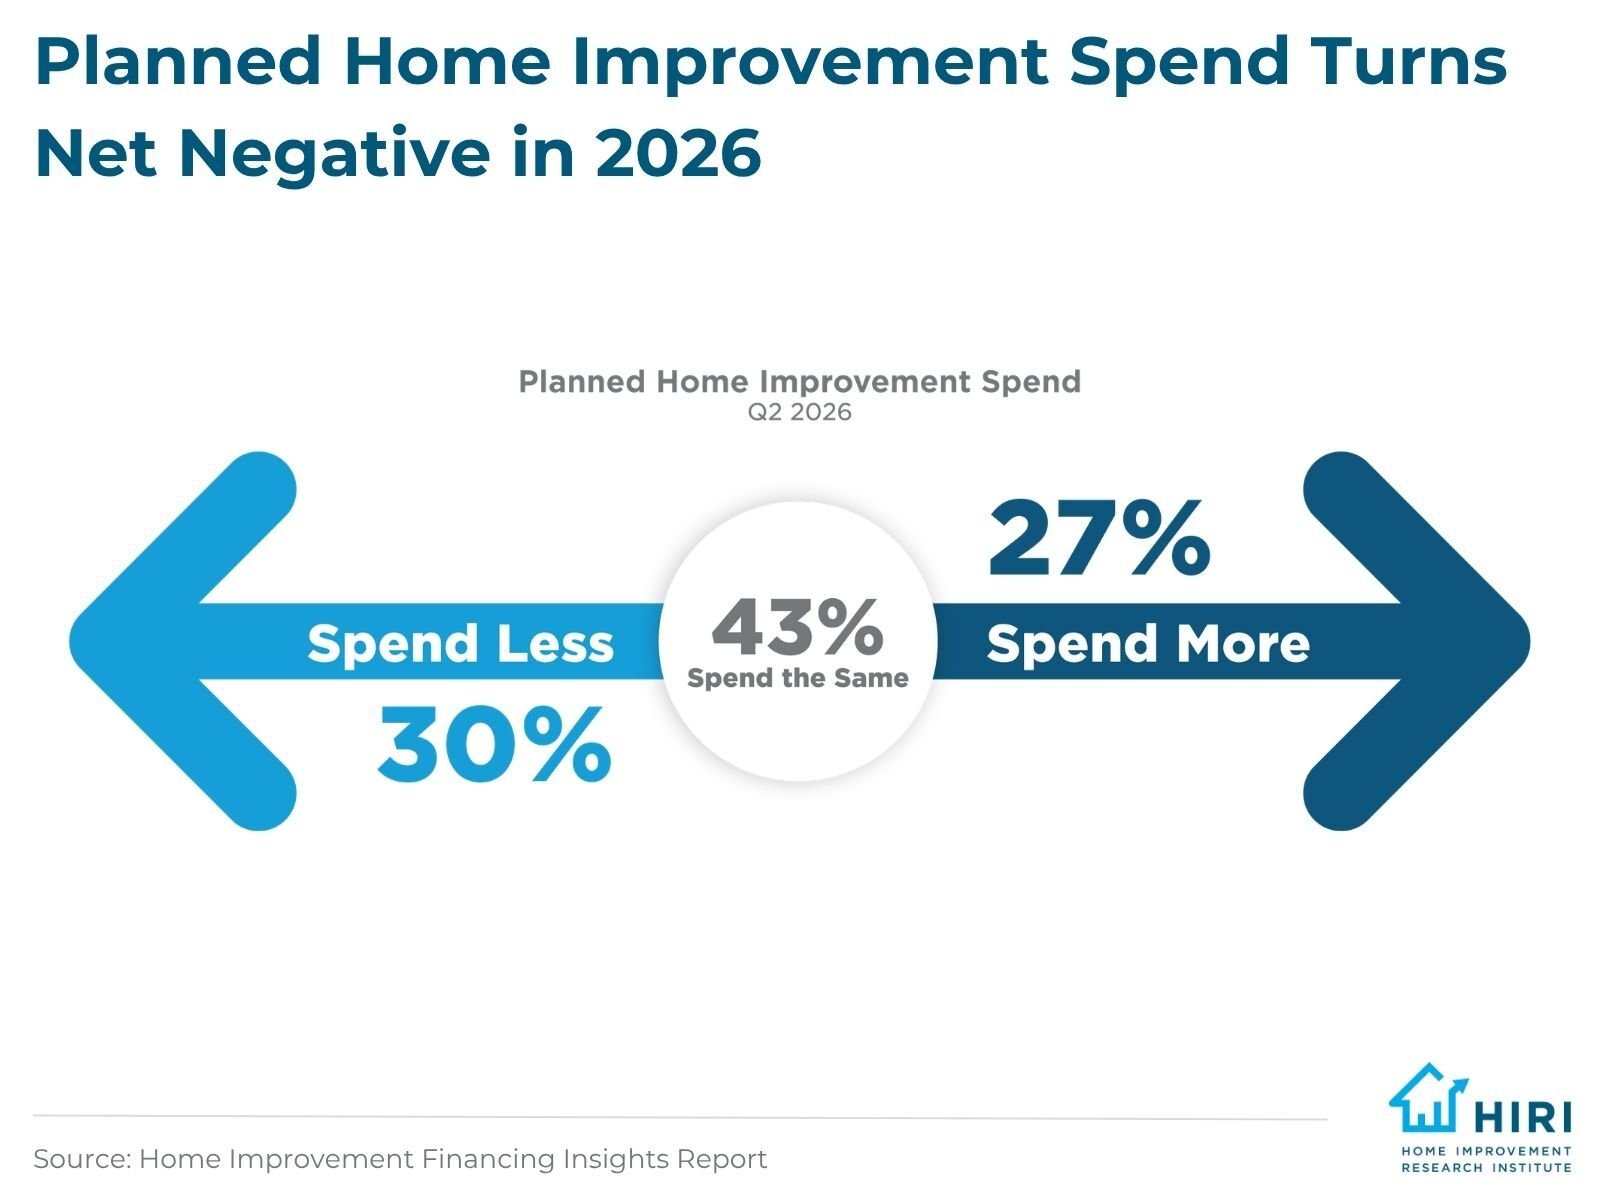
Planned Home Improvement Spend Turns Net-Negative in 2026
Planned homeowner spend is one important indicator of the health of the home improvement market. In Q2 2026, home improvement spend intent turned net-negative, which means more households are planning to spend less on home improvement activities in the next 12 months than are planning to spend more (or 30% and 27%, respectively). About 43% plan to spend the same. This is a noteworthy change from previous sentiment, with prior HIRI data showing positive readings across the prior nine quarters. It indicates the financial strain that many homeowners in the U.S. are currently feeling in 2026.
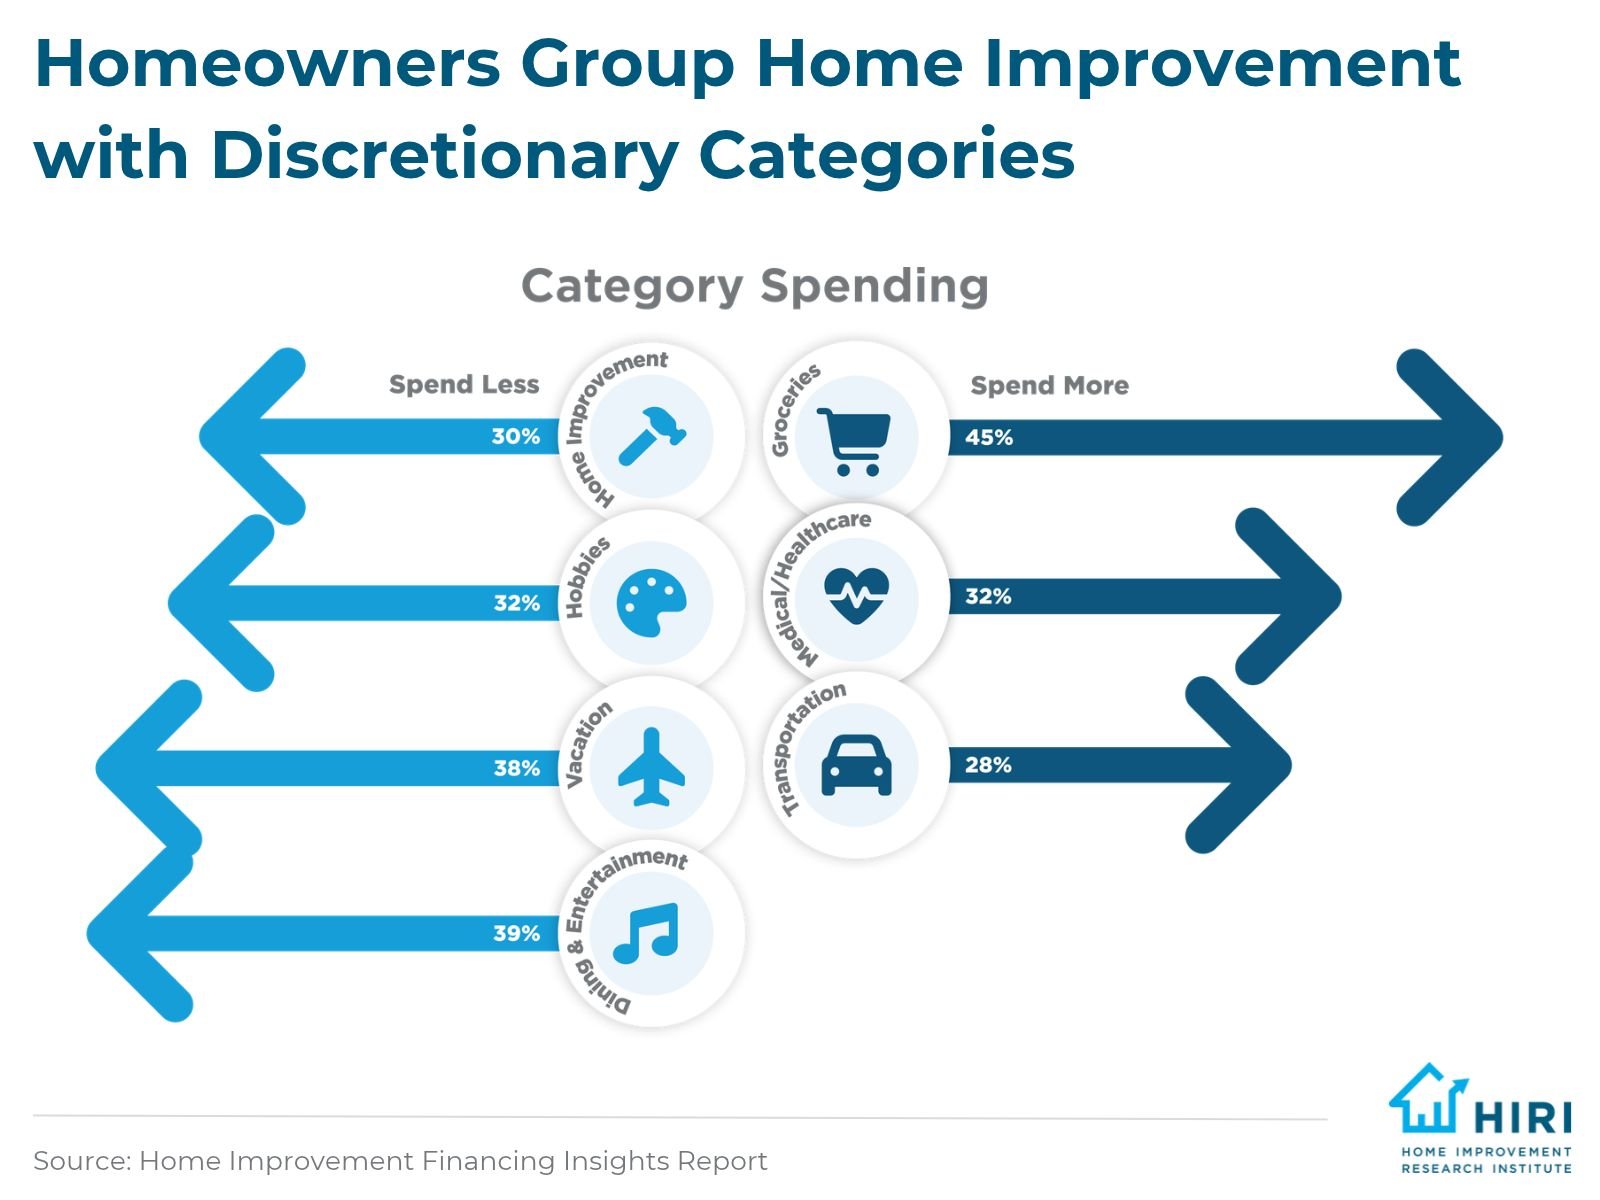
Homeowners are Grouping Home Improvement with Other Discretionary Spending Categories
When it comes to the main categories of household spending, the intent around home improvement spending sits between protected essentials and clearly pressured discretionary spending. For example, 32% of homeowners plan to spend more on medical/healthcare expenses over the next 12 months, while 45% plan to spend more on groceries and 28% plan to spend more on transportation. Meanwhile, homeowners are planning to spend notably less on categories such as hobbies, vacation, and dining and entertainment. This trend serves as an indication of where homeowners' priorities lie and how they're adjusting to macroeconomic pressures.
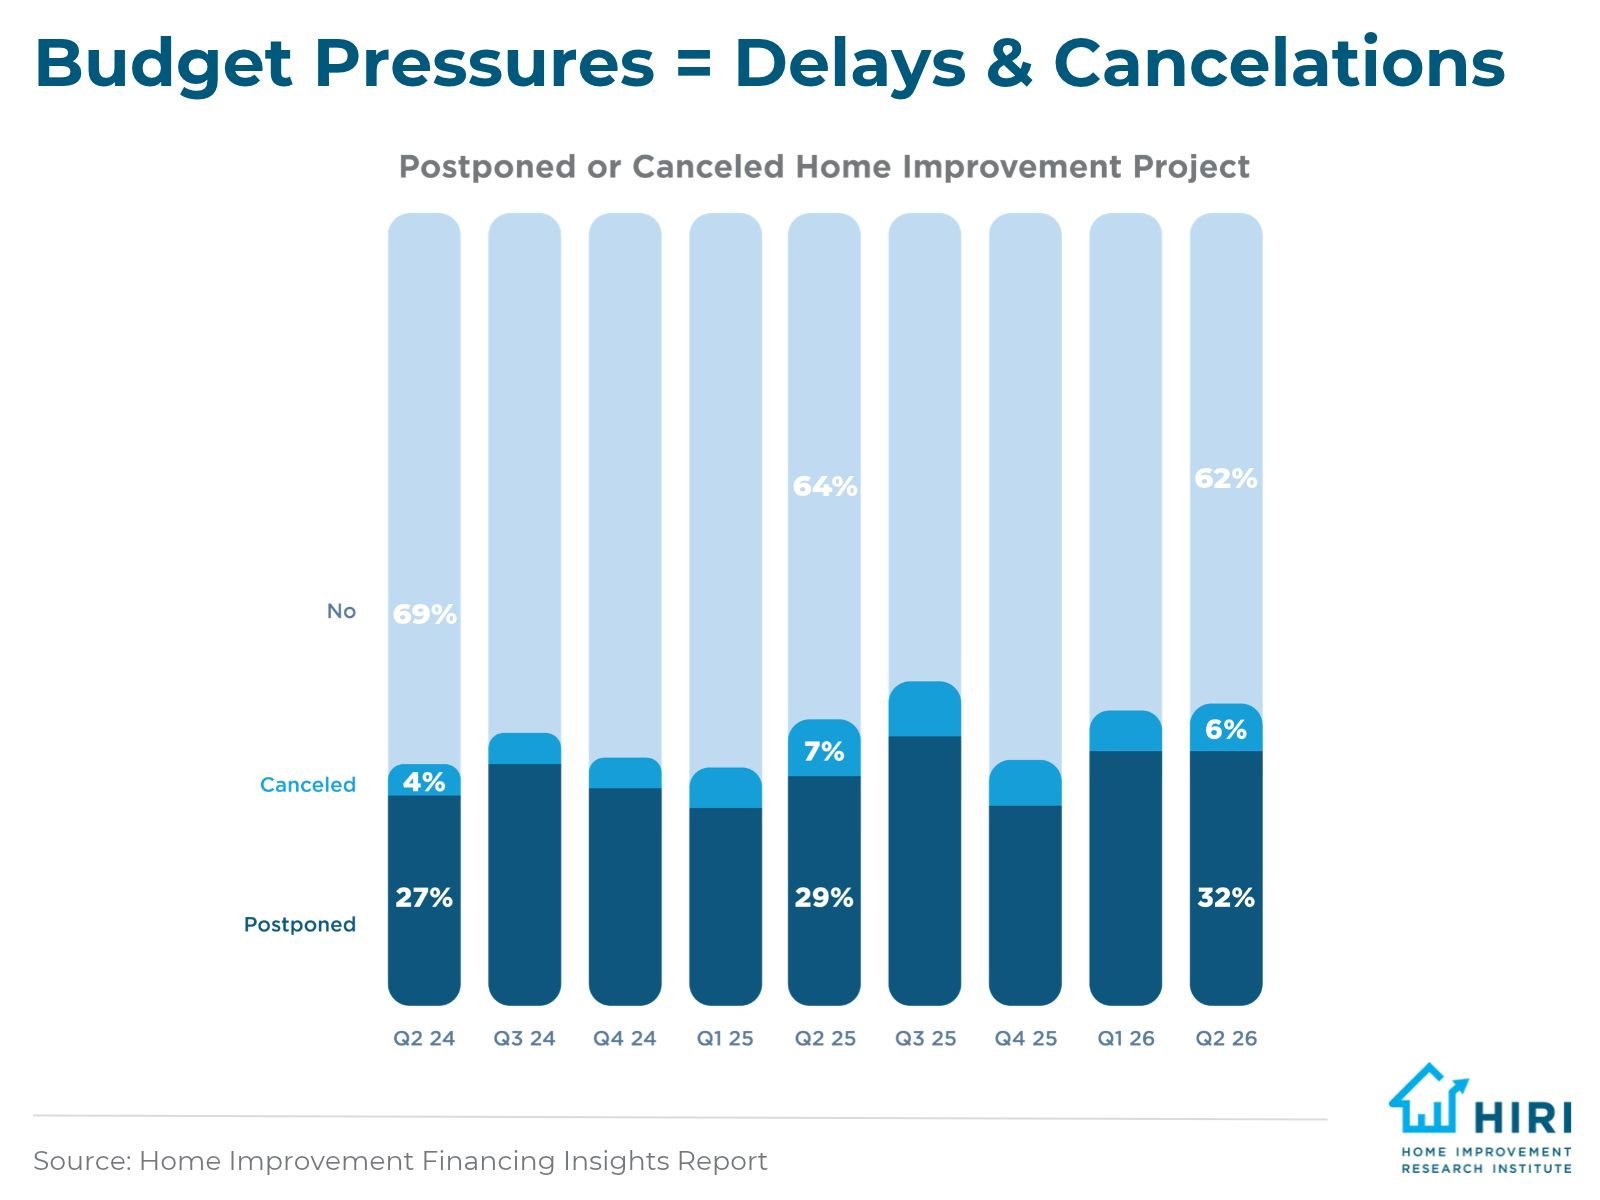
Budget Pressures Spur Project Delays and Cancellations
Project cancellations experienced a roughly 67% increase from 2024 to 2025, whereas delayed projects increased slightly, from approximately 27.9% in 2024 to 29% in 2025. Postponement and cancellation rates have held steady at elevated levels in the first two quarters of 2026 (the most up-to-date tracking available). For example, 32% of projects were postponed in both the first and second quarters of 2026, while between 5% and 6% of projects were canceled. The main reasons for cancelled and postponed projects in Q2 2026 include budget/financial reasons, labor costs, and schedule/timing.
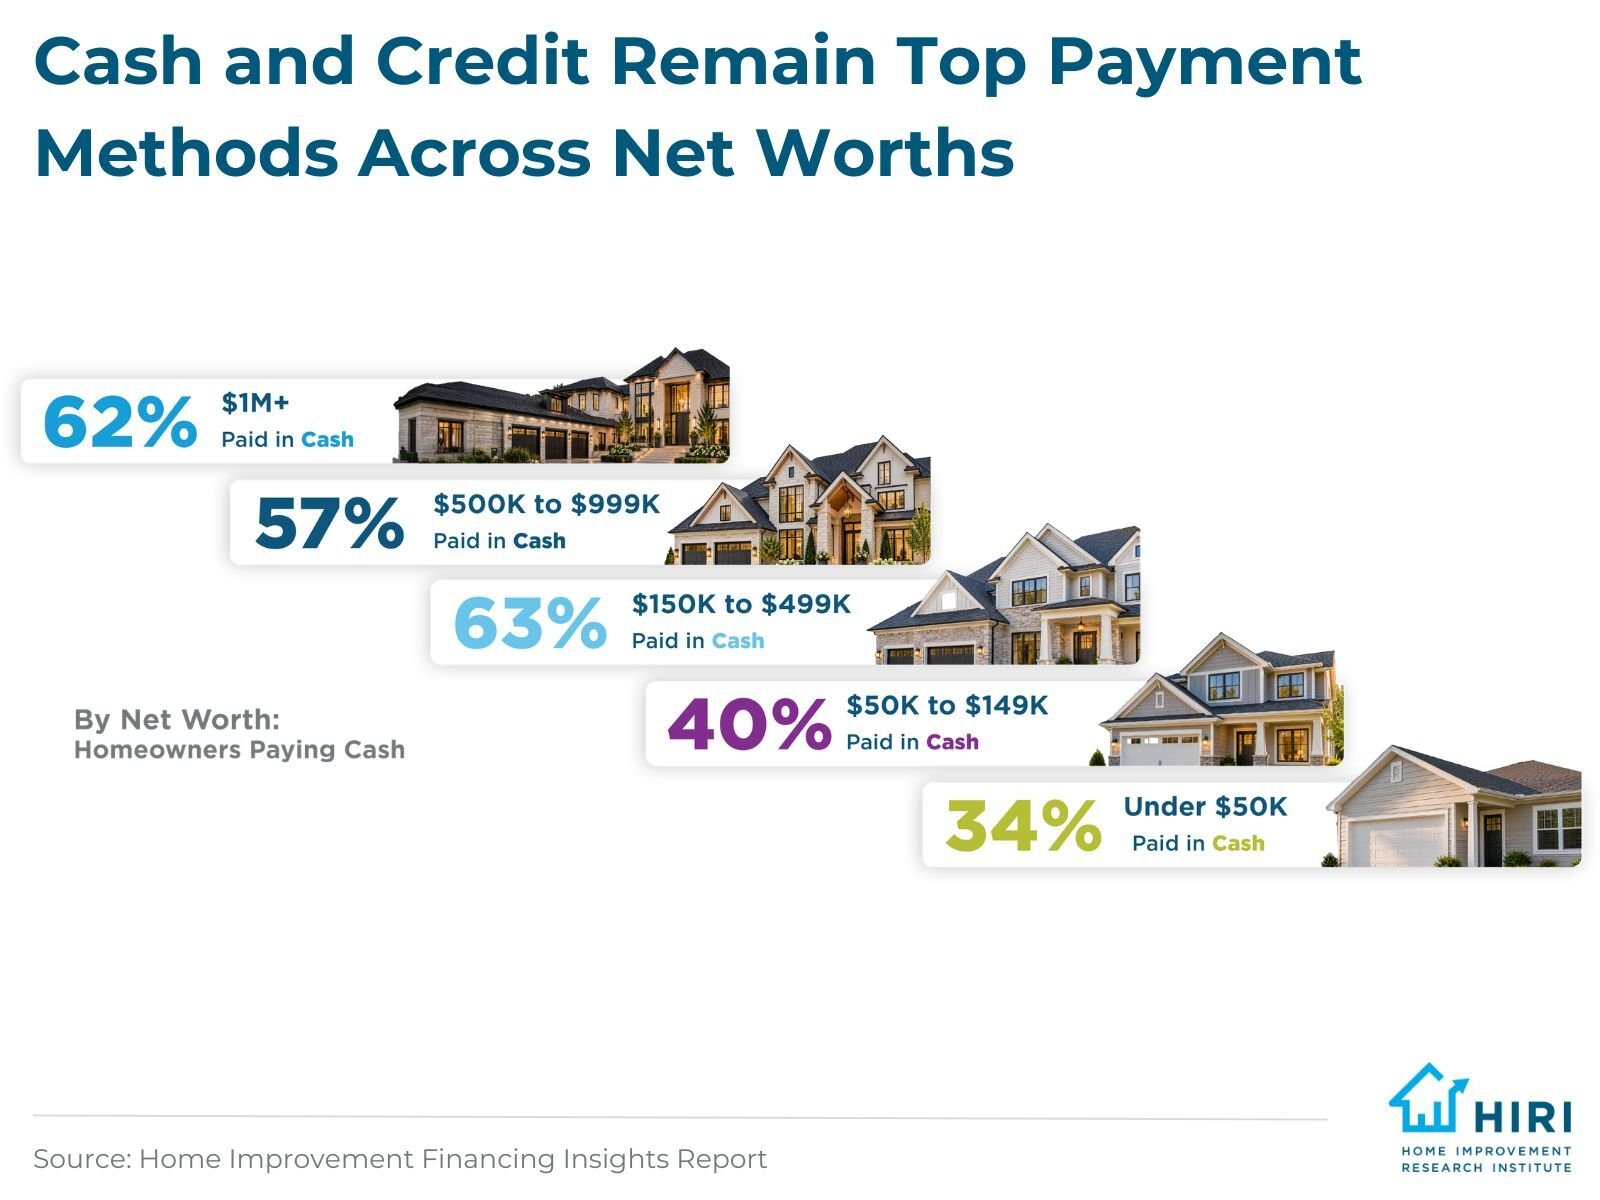
Cash and Credit Remain Top Payment Methods for Home Improvement Projects
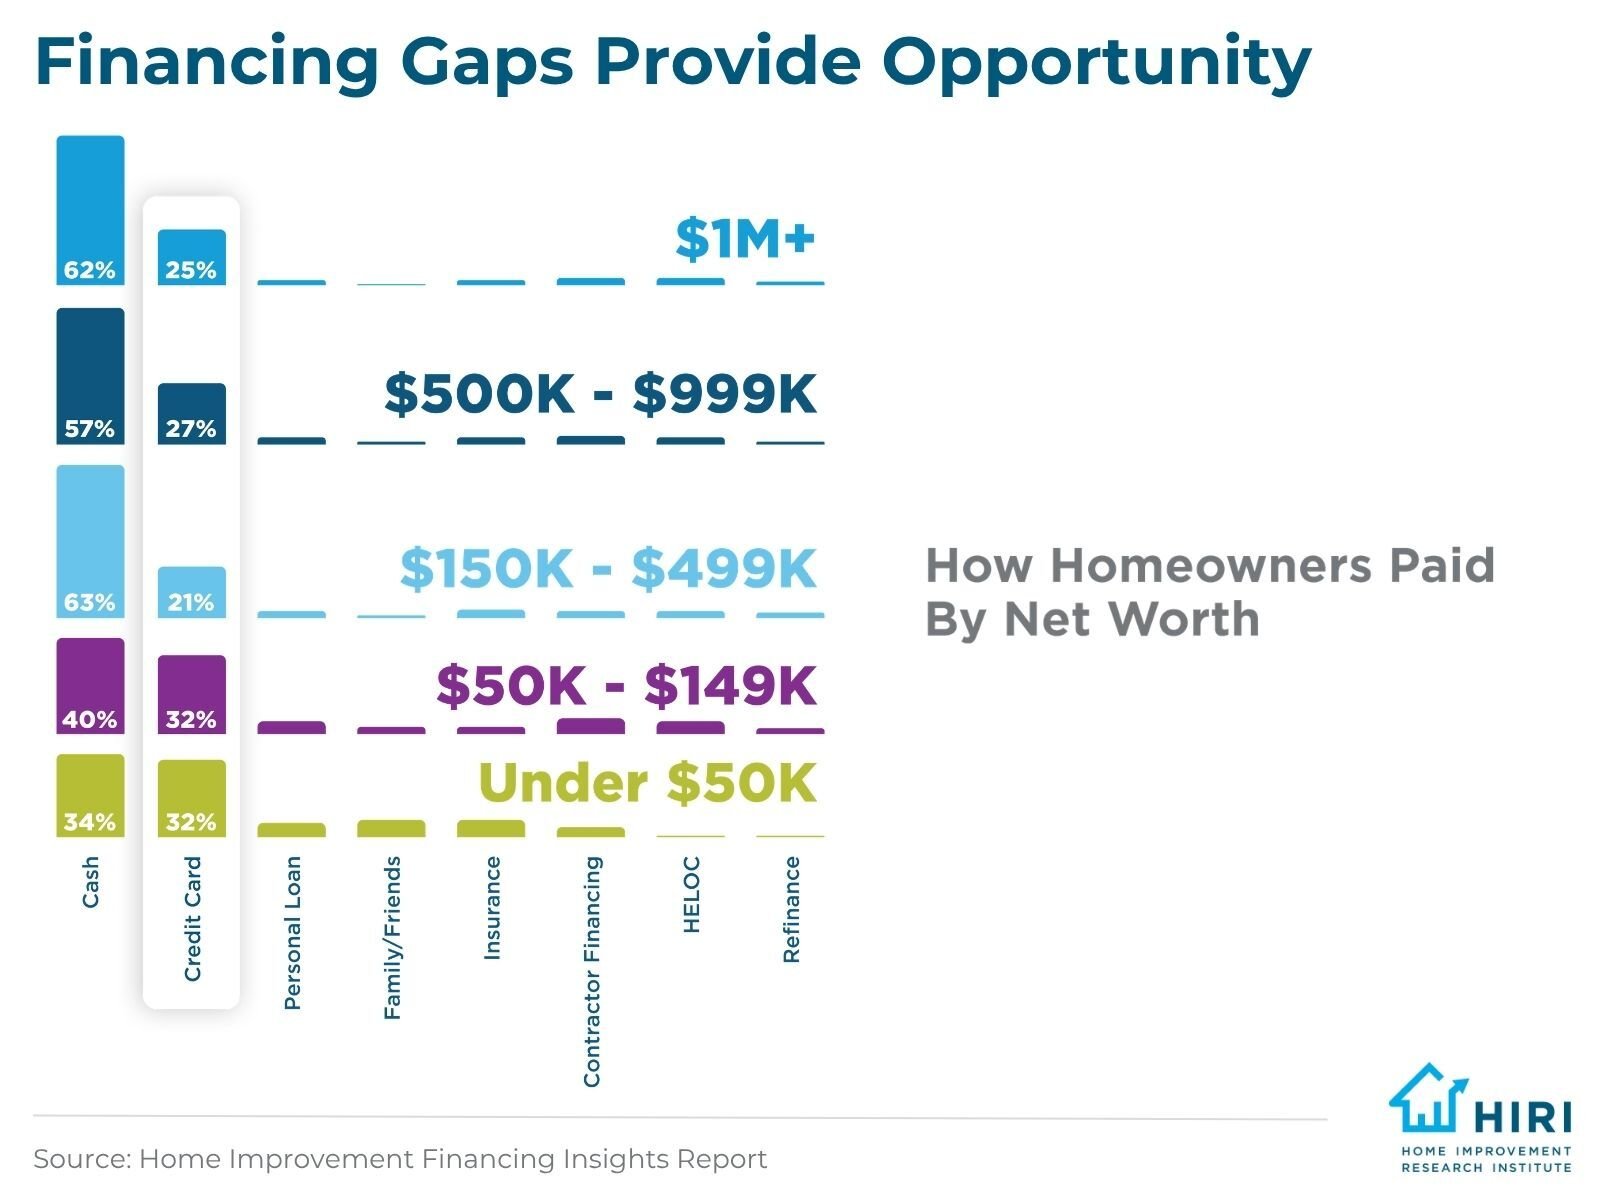
How homeowners pay for their home improvement projects varies significantly across income brackets and net worth and provides further insight into how financing factors into the bigger picture of home improvement activity. The households with incomes in the $150K to $499K range most frequently pay cash for their projects, whereas homeowners in the $50K to $149K range use cash for 40% of projects and those making under $50K use it for approximately 34% of projects. Other common payment methods include credit cards, personal loans, and family/friends.
Financing Gaps Provide Opportunity for Home Improvement Brands
Despite rising project costs in 2026, there hasn't been a significant increase in homeowners using financing as an alternative payment method. Instead, homeowners under $150K in net worth use credit card for 32% of projects, even though credit is a more costly option. This demographic represents an opportunity for expanding financial services, especially those that are more cost-effective than high-interest credit cards, to help them feel empowered to take on projects that they want to do but currently view as unaffordable. As financial pressures and affordability lead to delayed and postponed projects, financing provides a unique opportunity for home improvement brands to help homeowners keep their much-desired activities moving forward. Product pricing is also an important consideration to maintain market share in the currently tight market.
Gain Insight into How Financing Shapes Homeowner and Contractor Behavior
Financing expands what a homeowner thinks they can afford to do, not just how they pay for already-planned work. It also appears to help contractors land bigger jobs, although it does not affect their project volume or help them win a higher share of bids. HIRI’s Home Improvement Financing Insights report explores home improvement financing shapes homeowner and contractor behavior. The study examines where financing use is concentrated, where it lags behind project value, how it relates to project size, and impacts contractor revenue growth. HIRI members can use these findings to identify which homeowner segments, product categories, and contractor partners represent the clearest opportunity for a financing product.
As a member of HIRI, you can gain access to our Home Improvement Financing Insights Report, as well as the research files used to compile this data. Financial services members can use these findings to identify which homeowner segments, product categories, and contractor partners represent the clearest opportunity for a financing product.
Additionally, HIRI members have access to market and customer behavior data across home improvement product categories and are able to slice-and-dice the raw data as needed.
Book your membership consultation to learn more about the member exclusive information your teams would have access to.